29
/pt/
pt
AIzaSyAYiBZKx7MnpbEhh9jyipgxe19OcubqV5w
April 1, 2024
222973
Peru
PER
true
2
1
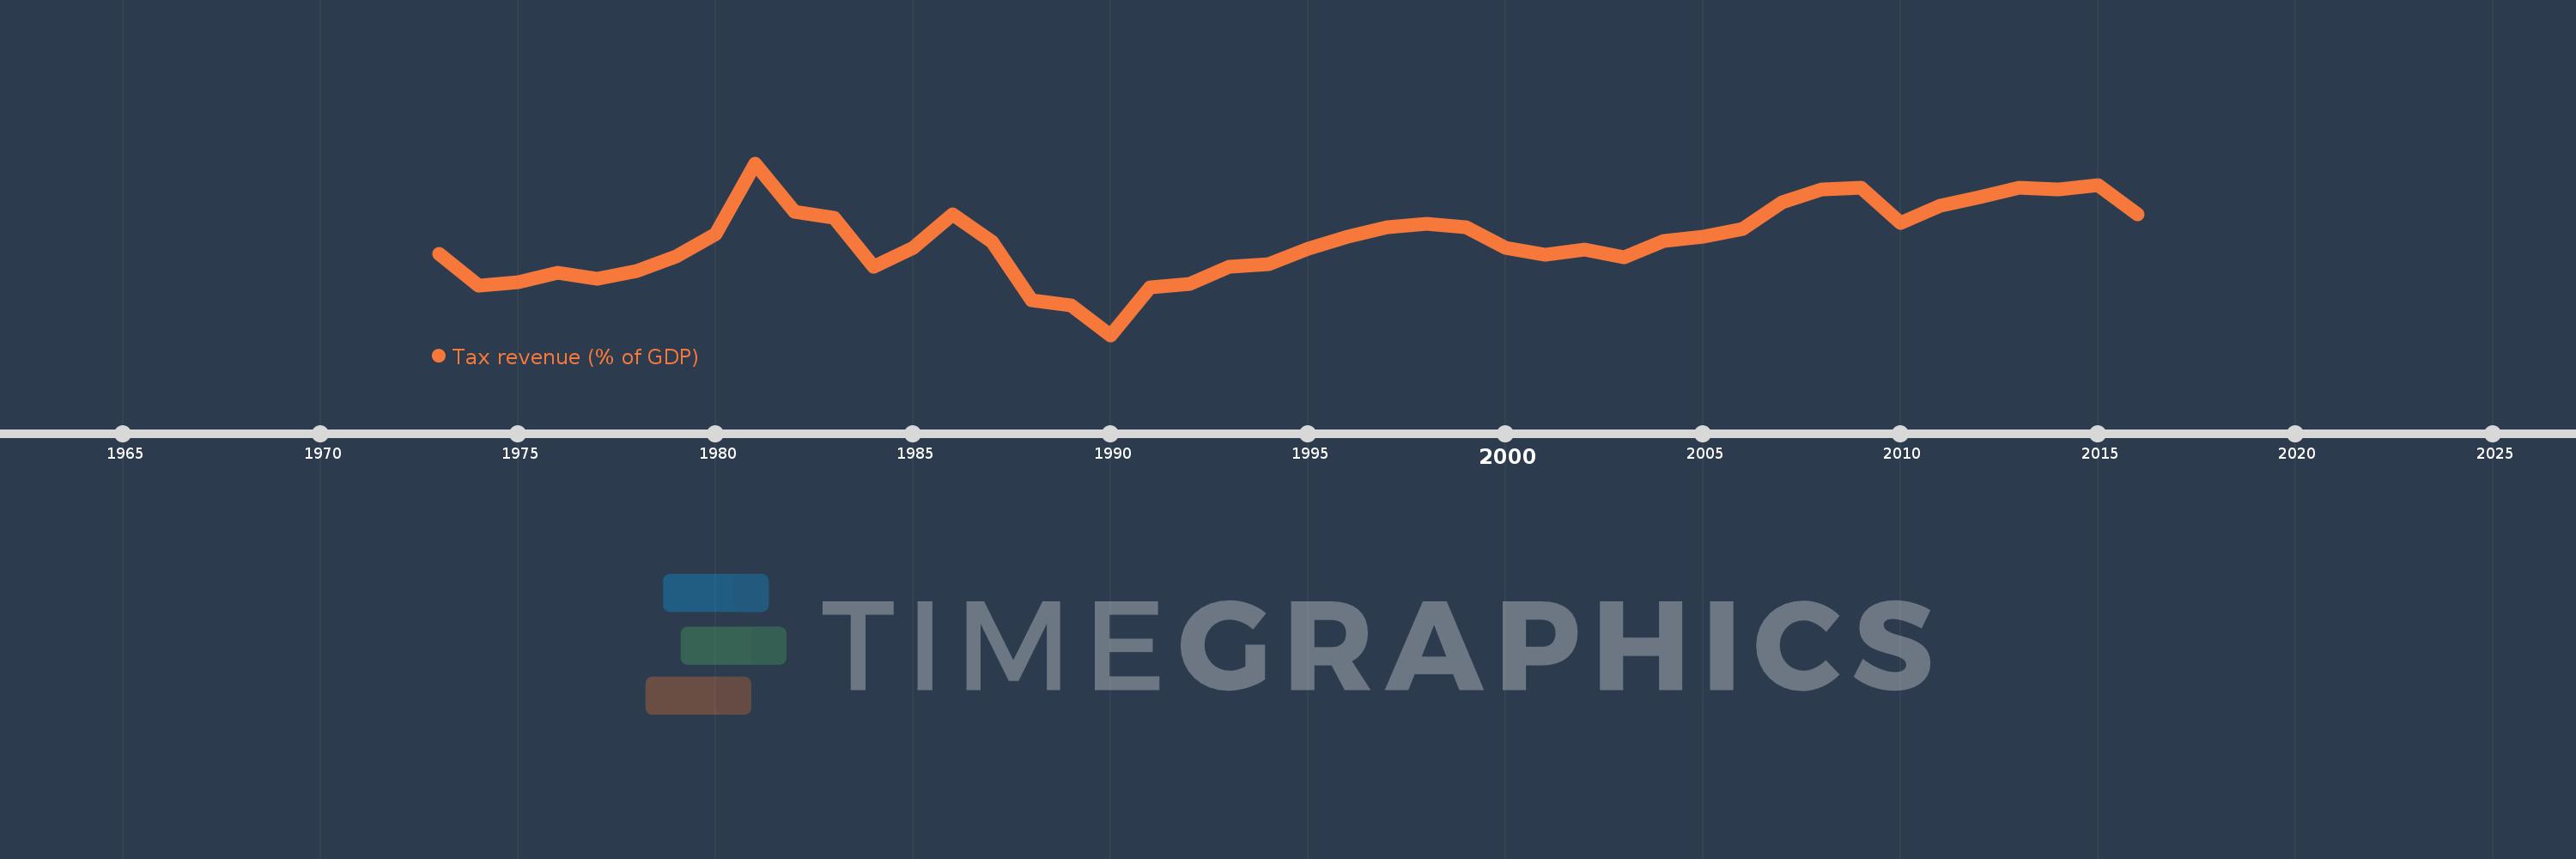
Tax revenue (% of GDP)
2016,2015,2014,2013,2012,2011,2010,2009,2008,2007,2006,2005,2004,2003,2002,2001,2000,1999,1998,1997,1996,1995,1994,1993,1992,1991,1990,1989,1988,1987,1986,1985,1984,1983,1982,1981,1980,1979,1978,1977,1976,1975,1974,1973
Estas estatísticas em outros países:
AfghanistanAlbaniaAlgeriaAngolaAntigua and BarbudaArgentinaArmeniaAustraliaAustriaAzerbaijanBahamas, TheBahrainBangladeshBarbadosBelarusBelgiumBelizeBeninBhutanBoliviaBosnia and HerzegovinaBotswanaBrazilBulgariaBurkina FasoBurundiCabo VerdeCambodiaCanadaCaribbean small statesCentral African RepublicCentral Europe and the BalticsChileChinaColombiaCongo, Dem. Rep.Congo, Rep.Costa RicaCote d'IvoireCroatiaCyprusCzech RepublicDenmarkDominicaDominican RepublicEarly-demographic dividendEast Asia & PacificEast Asia & Pacific (excluding high income)East Asia & Pacific (IDA & IBRD countries)Egypt, Arab Rep.El SalvadorEquatorial GuineaEstoniaEthiopiaEuro areaEurope & Central AsiaEurope & Central Asia (excluding high income)Europe & Central Asia (IDA & IBRD countries)European UnionFijiFinlandFranceGambia, TheGeorgiaGermanyGhanaGreeceGrenadaGuatemalaHeavily indebted poor countries (HIPC)High incomeHondurasHong Kong SAR, ChinaHungaryIBRD onlyIcelandIDA & IBRD totalIDA blendIDA onlyIDA totalIndiaIndonesiaIran, Islamic Rep.IraqIrelandIsraelItalyJamaicaJapanJordanKazakhstanKenyaKiribatiKorea, Rep.KuwaitKyrgyz RepublicLao PDRLate-demographic dividendLatin America & Caribbean Latin America & Caribbean (excluding high income)Latin America & the Caribbean (IDA & IBRD countries)LatviaLeast developed countries: UN classificationLebanonLesothoLiberiaLithuaniaLow & middle incomeLow incomeLower middle incomeLuxembourgMacao SAR, ChinaMacedonia, FYRMadagascarMalawiMalaysiaMaldivesMaliMaltaMauritiusMexicoMicronesia, Fed. Sts.Middle East & North Africa (excluding high income)Middle East & North Africa (IDA & IBRD countries)Middle incomeMoldovaMongoliaMoroccoMozambiqueMyanmarNamibiaNepalNetherlandsNew ZealandNicaraguaNigeriaNorth AmericaNorwayOECD membersOmanOther small statesPacific island small statesPakistanPanamaPapua New GuineaParaguayPeruPhilippinesPolandPortugalPost-demographic dividendPre-demographic dividendQatarRomaniaRussian FederationRwandaSamoaSan MarinoSao Tome and PrincipeSenegalSerbiaSeychellesSierra LeoneSingaporeSlovak RepublicSloveniaSmall statesSolomon IslandsSouth AfricaSouth AsiaSouth Asia (IDA & IBRD)SpainSri LankaSt. Kitts and NevisSt. LuciaSt. Vincent and the GrenadinesSub-Saharan Africa Sub-Saharan Africa (excluding high income)Sub-Saharan Africa (IDA & IBRD countries)SurinameSwazilandSwedenSwitzerlandSyrian Arab RepublicTajikistanTanzaniaThailandTimor-LesteTogoTrinidad and TobagoTunisiaTurkeyUgandaUkraineUnited Arab EmiratesUnited KingdomUnited StatesUpper middle incomeUruguayVanuatuVenezuela, RBVietnamWest Bank and GazaWorldYemen, Rep.ZambiaZimbabwe Linha do tempo:
Nesta escala de tempo está apresentado um gráfico de 1973 ano até 2016 ano Peru. Dados de 1972 ano ausente. O número de observações reais por data: 44.
Fonte (nome):
Indicadores de desenvolvimento mundial
Fonte (organização):
International Monetary Fund, Government Finance Statistics Yearbook and data files, and World Bank and OECD GDP estimates.
Categorias:
Public Sector
Foi atualizado:
23 abr 2017 ano
Indicadores de alterações dos valores ao longo dos anos
Mínimo:
7.922
1 jan 1990 ano
Máximo:
17.962
1 jan 1981 ano
Na data de observação
Valor
Mudança absoluta
A alteração em relação ao valor anterior
1 jan 1973 ano
12.654
+12.654
0.0%
1 jan 1974 ano
10.811
-1.842
-14.56%
1 jan 1975 ano
11.001
+0.19
1.75%
1 jan 1976 ano
11.558
+0.557
5.06%
1 jan 1977 ano
11.229
-0.329
-2.84%
1 jan 1978 ano
11.672
+0.443
3.94%
1 jan 1979 ano
12.493
+0.821
7.04%
1 jan 1980 ano
13.807
+1.314
10.52%
1 jan 1981 ano
17.962
+4.155
30.09%
1 jan 1982 ano
15.116
-2.845
-15.84%
1 jan 1983 ano
14.793
-0.323
-2.14%
1 jan 1984 ano
11.898
-2.895
-19.57%
1 jan 1985 ano
13.04
+1.143
9.6%
1 jan 1986 ano
14.963
+1.923
14.74%
1 jan 1987 ano
13.382
-1.581
-10.57%
1 jan 1988 ano
9.974
-3.408
-25.46%
1 jan 1989 ano
9.664
-0.311
-3.12%
1 jan 1990 ano
7.922
-1.742
-18.03%
1 jan 1991 ano
10.724
+2.802
35.37%
1 jan 1992 ano
10.923
+0.199
1.85%
1 jan 1993 ano
11.926
+1.003
9.18%
1 jan 1994 ano
12.053
+0.127
1.06%
1 jan 1995 ano
12.972
+0.92
7.63%
1 jan 1996 ano
13.685
+0.713
5.49%
1 jan 1997 ano
14.2
+0.515
3.76%
1 jan 1998 ano
14.399
+0.199
1.4%
1 jan 1999 ano
14.235
-0.164
-1.14%
1 jan 2000 ano
12.994
-1.241
-8.72%
1 jan 2001 ano
12.609
-0.386
-2.97%
1 jan 2002 ano
12.897
+0.288
2.29%
1 jan 2003 ano
12.487
-0.41
-3.18%
1 jan 2004 ano
13.412
+0.924
7.4%
1 jan 2005 ano
13.663
+0.252
1.88%
1 jan 2006 ano
14.105
+0.441
3.23%
1 jan 2007 ano
15.67
+1.565
11.1%
1 jan 2008 ano
16.407
+0.737
4.71%
1 jan 2009 ano
16.512
+0.105
0.64%
1 jan 2010 ano
14.457
-2.056
-12.45%
1 jan 2011 ano
15.467
+1.01
6.99%
1 jan 2012 ano
15.969
+0.502
3.25%
1 jan 2013 ano
16.547
+0.578
3.62%
1 jan 2014 ano
16.43
-0.117
-0.71%
1 jan 2015 ano
16.698
+0.269
1.64%
1 jan 2016 ano
14.966
-1.732
-10.37%
Classificação de países por estatísticas atuais por anos


Comentários: