29
/pt/
pt
AIzaSyAYiBZKx7MnpbEhh9jyipgxe19OcubqV5w
April 1, 2024
90893
Brazil
BRA
true
2
1
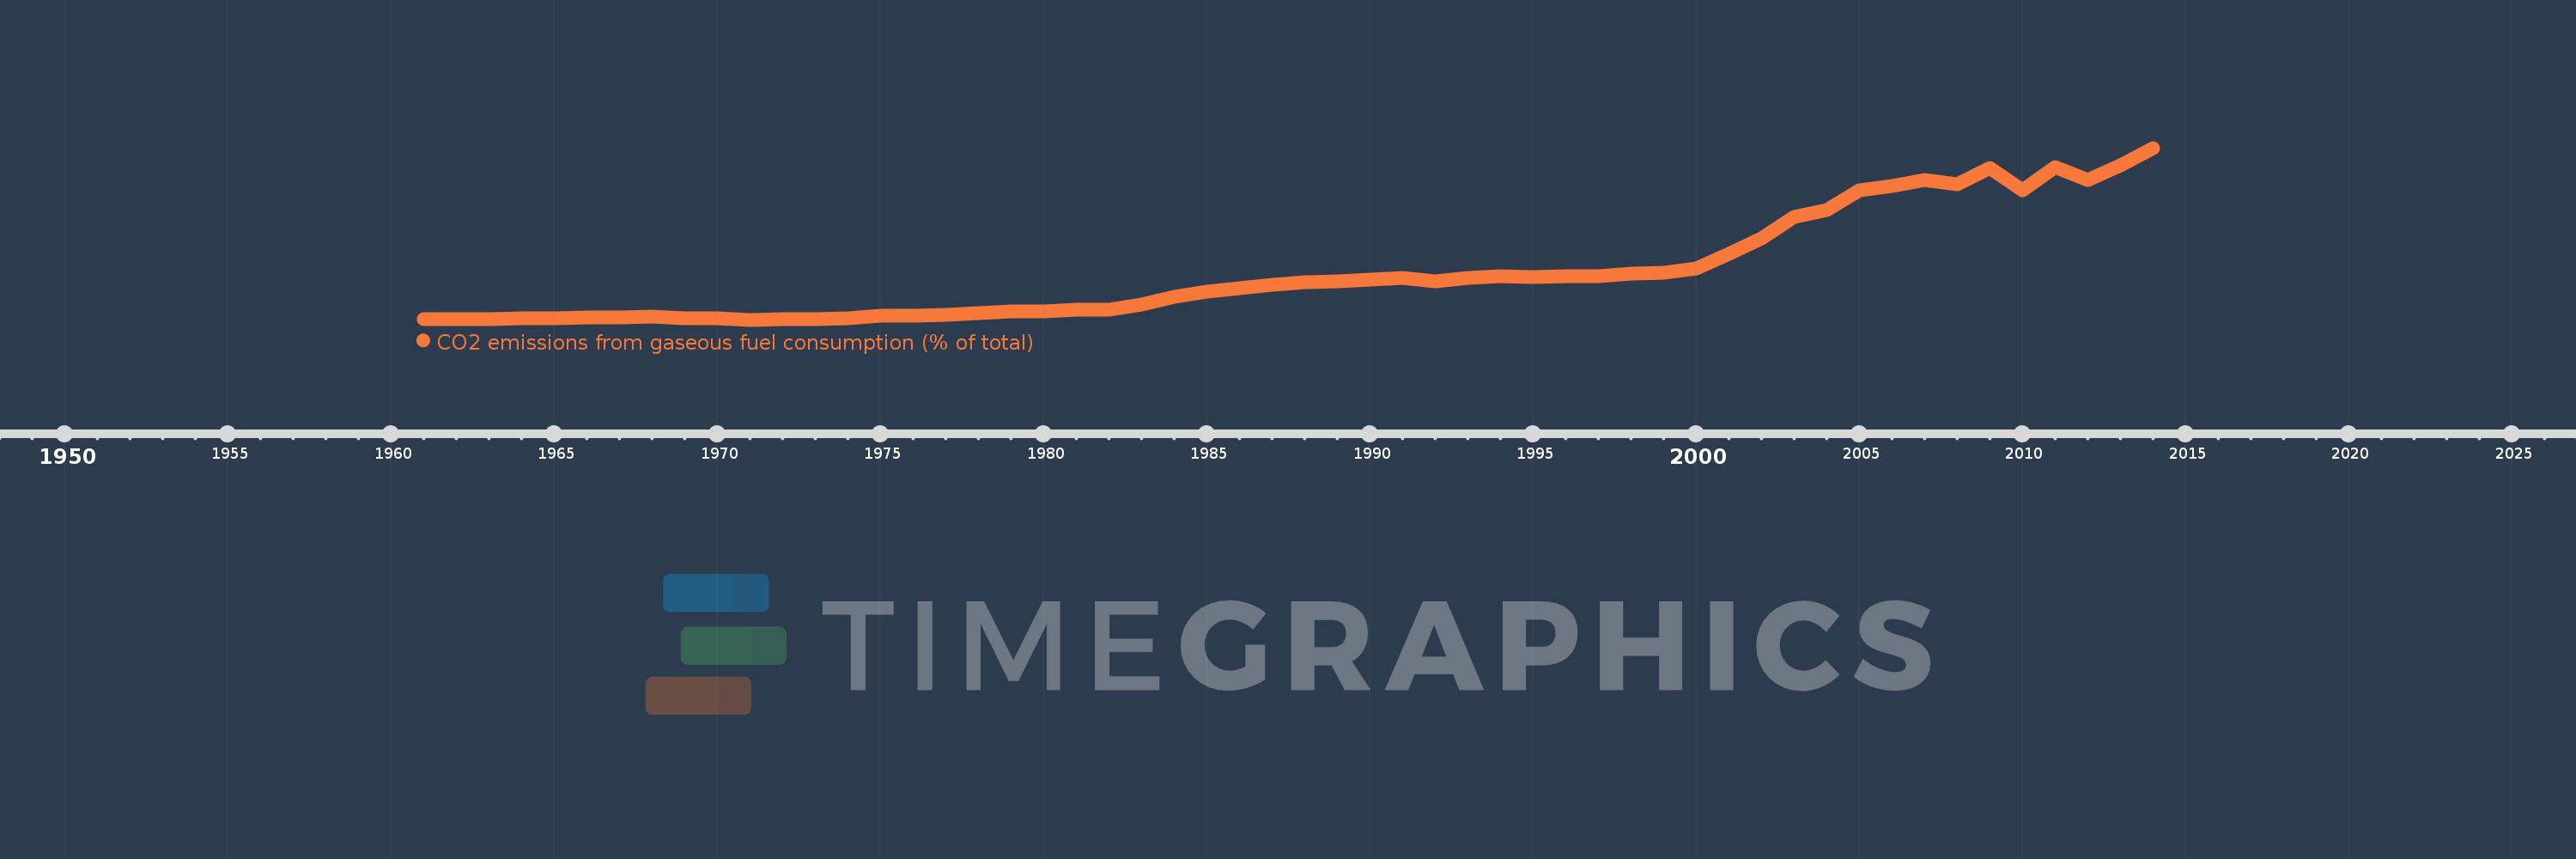
CO2 emissions from gaseous fuel consumption (% of total)
2014,2013,2012,2011,2010,2009,2008,2007,2006,2005,2004,2003,2002,2001,2000,1999,1998,1997,1996,1995,1994,1993,1992,1991,1990,1989,1988,1987,1986,1985,1984,1983,1982,1981,1980,1979,1978,1977,1976,1975,1974,1973,1972,1971,1970,1969,1968,1967,1966,1965,1964,1963,1962,1961
Estas estatísticas em outros países:
AfghanistanAlbaniaAlgeriaAndorraAngolaAntigua and BarbudaArab WorldArgentinaArmeniaArubaAustraliaAustriaAzerbaijanBahamas, TheBahrainBangladeshBarbadosBelarusBelgiumBelizeBeninBermudaBhutanBoliviaBosnia and HerzegovinaBotswanaBrazilBritish Virgin IslandsBrunei DarussalamBulgariaBurkina FasoBurundiCabo VerdeCambodiaCameroonCanadaCaribbean small statesCayman IslandsCentral African RepublicCentral Europe and the BalticsChadChileChinaColombiaComorosCongo, Dem. Rep.Congo, Rep.Costa RicaCote d'IvoireCroatiaCubaCuracaoCyprusCzech RepublicDenmarkDjiboutiDominicaDominican RepublicEarly-demographic dividendEast Asia & PacificEast Asia & Pacific (excluding high income)East Asia & Pacific (IDA & IBRD countries)EcuadorEgypt, Arab Rep.El SalvadorEquatorial GuineaEritreaEstoniaEthiopiaEuro areaEurope & Central AsiaEurope & Central Asia (excluding high income)Europe & Central Asia (IDA & IBRD countries)European UnionFaroe IslandsFijiFinlandFragile and conflict affected situationsFranceFrench PolynesiaGabonGambia, TheGeorgiaGermanyGhanaGibraltarGreeceGreenlandGrenadaGuatemalaGuineaGuinea-BissauGuyanaHaitiHeavily indebted poor countries (HIPC)High incomeHondurasHong Kong SAR, ChinaHungaryIBRD onlyIcelandIDA & IBRD totalIDA blendIDA onlyIDA totalIndiaIndonesiaIran, Islamic Rep.IraqIrelandIsraelItalyJamaicaJapanJordanKazakhstanKenyaKiribatiKorea, Dem. People’s Rep.Korea, Rep.KuwaitKyrgyz RepublicLao PDRLate-demographic dividendLatin America & Caribbean Latin America & Caribbean (excluding high income)Latin America & the Caribbean (IDA & IBRD countries)LatviaLeast developed countries: UN classificationLebanonLesothoLiberiaLibyaLiechtensteinLithuaniaLow & middle incomeLow incomeLower middle incomeLuxembourgMacao SAR, ChinaMacedonia, FYRMadagascarMalawiMalaysiaMaldivesMaliMaltaMarshall IslandsMauritaniaMauritiusMexicoMicronesia, Fed. Sts.Middle East & North AfricaMiddle East & North Africa (excluding high income)Middle East & North Africa (IDA & IBRD countries)Middle incomeMoldovaMongoliaMontenegroMoroccoMozambiqueMyanmarNamibiaNauruNepalNetherlandsNew CaledoniaNew ZealandNicaraguaNigerNigeriaNorth AmericaNorwayOECD membersOmanOther small statesPacific island small statesPakistanPalauPanamaPapua New GuineaParaguayPeruPhilippinesPolandPortugalPost-demographic dividendPre-demographic dividendQatarRomaniaRussian FederationRwandaSamoaSao Tome and PrincipeSaudi ArabiaSenegalSerbiaSeychellesSierra LeoneSingaporeSint Maarten (Dutch part)Slovak RepublicSloveniaSmall statesSolomon IslandsSomaliaSouth AfricaSouth AsiaSouth Asia (IDA & IBRD)South SudanSpainSri LankaSt. Kitts and NevisSt. LuciaSt. Vincent and the GrenadinesSub-Saharan Africa Sub-Saharan Africa (excluding high income)Sub-Saharan Africa (IDA & IBRD countries)SudanSurinameSwazilandSwedenSwitzerlandSyrian Arab RepublicTajikistanTanzaniaThailandTimor-LesteTogoTongaTrinidad and TobagoTunisiaTurkeyTurkmenistanTurks and Caicos IslandsUgandaUkraineUnited Arab EmiratesUnited KingdomUnited StatesUpper middle incomeUruguayUzbekistanVanuatuVenezuela, RBVietnamWest Bank and GazaWorldYemen, Rep.ZambiaZimbabwe Linha do tempo:
Nesta escala de tempo está apresentado um gráfico de 1961 ano até 2014 ano Brazil. Dados de 1960 ano ausente. O número de observações reais por data: 54.
Fonte (nome):
Indicadores de desenvolvimento mundial
Fonte (organização):
Carbon Dioxide Information Analysis Center, Environmental Sciences Division, Oak Ridge National Laboratory, Tennessee, United States.
Categorias:
Energy & Mining, Climate Change, Environment
Foi atualizado:
23 abr 2017 ano
Indicadores de alterações dos valores ao longo dos anos
Mínimo:
0.164
1 jan 1971 ano
Máximo:
14.123
1 jan 2014 ano
Na data de observação
Valor
Mudança absoluta
A alteração em relação ao valor anterior
1 jan 1961 ano
0.242
+0.242
0.0%
1 jan 1962 ano
0.231
-0.011
-4.67%
1 jan 1963 ano
0.205
-0.026
-11.32%
1 jan 1964 ano
0.297
+0.092
44.82%
1 jan 1965 ano
0.284
-0.012
-4.15%
1 jan 1966 ano
0.345
+0.06
21.18%
1 jan 1967 ano
0.382
+0.037
10.87%
1 jan 1968 ano
0.388
+0.006
1.5%
1 jan 1969 ano
0.298
-0.089
-23.05%
1 jan 1970 ano
0.278
-0.02
-6.72%
1 jan 1971 ano
0.164
-0.114
-40.99%
1 jan 1972 ano
0.243
+0.079
47.91%
1 jan 1973 ano
0.24
-0.002
-1.02%
1 jan 1974 ano
0.285
+0.045
18.57%
1 jan 1975 ano
0.483
+0.198
69.43%
1 jan 1976 ano
0.517
+0.034
6.95%
1 jan 1977 ano
0.591
+0.074
14.35%
1 jan 1978 ano
0.695
+0.104
17.68%
1 jan 1979 ano
0.839
+0.144
20.72%
1 jan 1980 ano
0.867
+0.027
3.23%
1 jan 1981 ano
1.007
+0.141
16.27%
1 jan 1982 ano
0.982
-0.026
-2.54%
1 jan 1983 ano
1.384
+0.403
41.0%
1 jan 1984 ano
2.029
+0.645
46.57%
1 jan 1985 ano
2.472
+0.443
21.84%
1 jan 1986 ano
2.758
+0.286
11.55%
1 jan 1987 ano
3.013
+0.255
9.25%
1 jan 1988 ano
3.202
+0.189
6.27%
1 jan 1989 ano
3.27
+0.068
2.13%
1 jan 1990 ano
3.416
+0.146
4.48%
1 jan 1991 ano
3.555
+0.138
4.05%
1 jan 1992 ano
3.312
-0.243
-6.83%
1 jan 1993 ano
3.536
+0.224
6.75%
1 jan 1994 ano
3.693
+0.158
4.46%
1 jan 1995 ano
3.651
-0.042
-1.15%
1 jan 1996 ano
3.672
+0.021
0.57%
1 jan 1997 ano
3.733
+0.061
1.66%
1 jan 1998 ano
3.926
+0.193
5.18%
1 jan 1999 ano
3.965
+0.039
1.0%
1 jan 2000 ano
4.349
+0.383
9.67%
1 jan 2001 ano
5.495
+1.146
26.36%
1 jan 2002 ano
6.787
+1.291
23.5%
1 jan 2003 ano
8.532
+1.746
25.72%
1 jan 2004 ano
9.083
+0.55
6.45%
1 jan 2005 ano
10.685
+1.603
17.65%
1 jan 2006 ano
11.022
+0.336
3.15%
1 jan 2007 ano
11.526
+0.504
4.58%
1 jan 2008 ano
11.172
-0.354
-3.07%
1 jan 2009 ano
12.53
+1.358
12.15%
1 jan 2010 ano
10.665
-1.865
-14.88%
1 jan 2011 ano
12.555
+1.89
17.73%
1 jan 2012 ano
11.498
-1.057
-8.42%
1 jan 2013 ano
12.739
+1.24
10.79%
1 jan 2014 ano
14.123
+1.385
10.87%
Classificação de países por estatísticas atuais por anos


Comentários: