29
/pt/
pt
AIzaSyAYiBZKx7MnpbEhh9jyipgxe19OcubqV5w
April 1, 2024
55375
Pre-demographic dividend
PRE
false
2
1
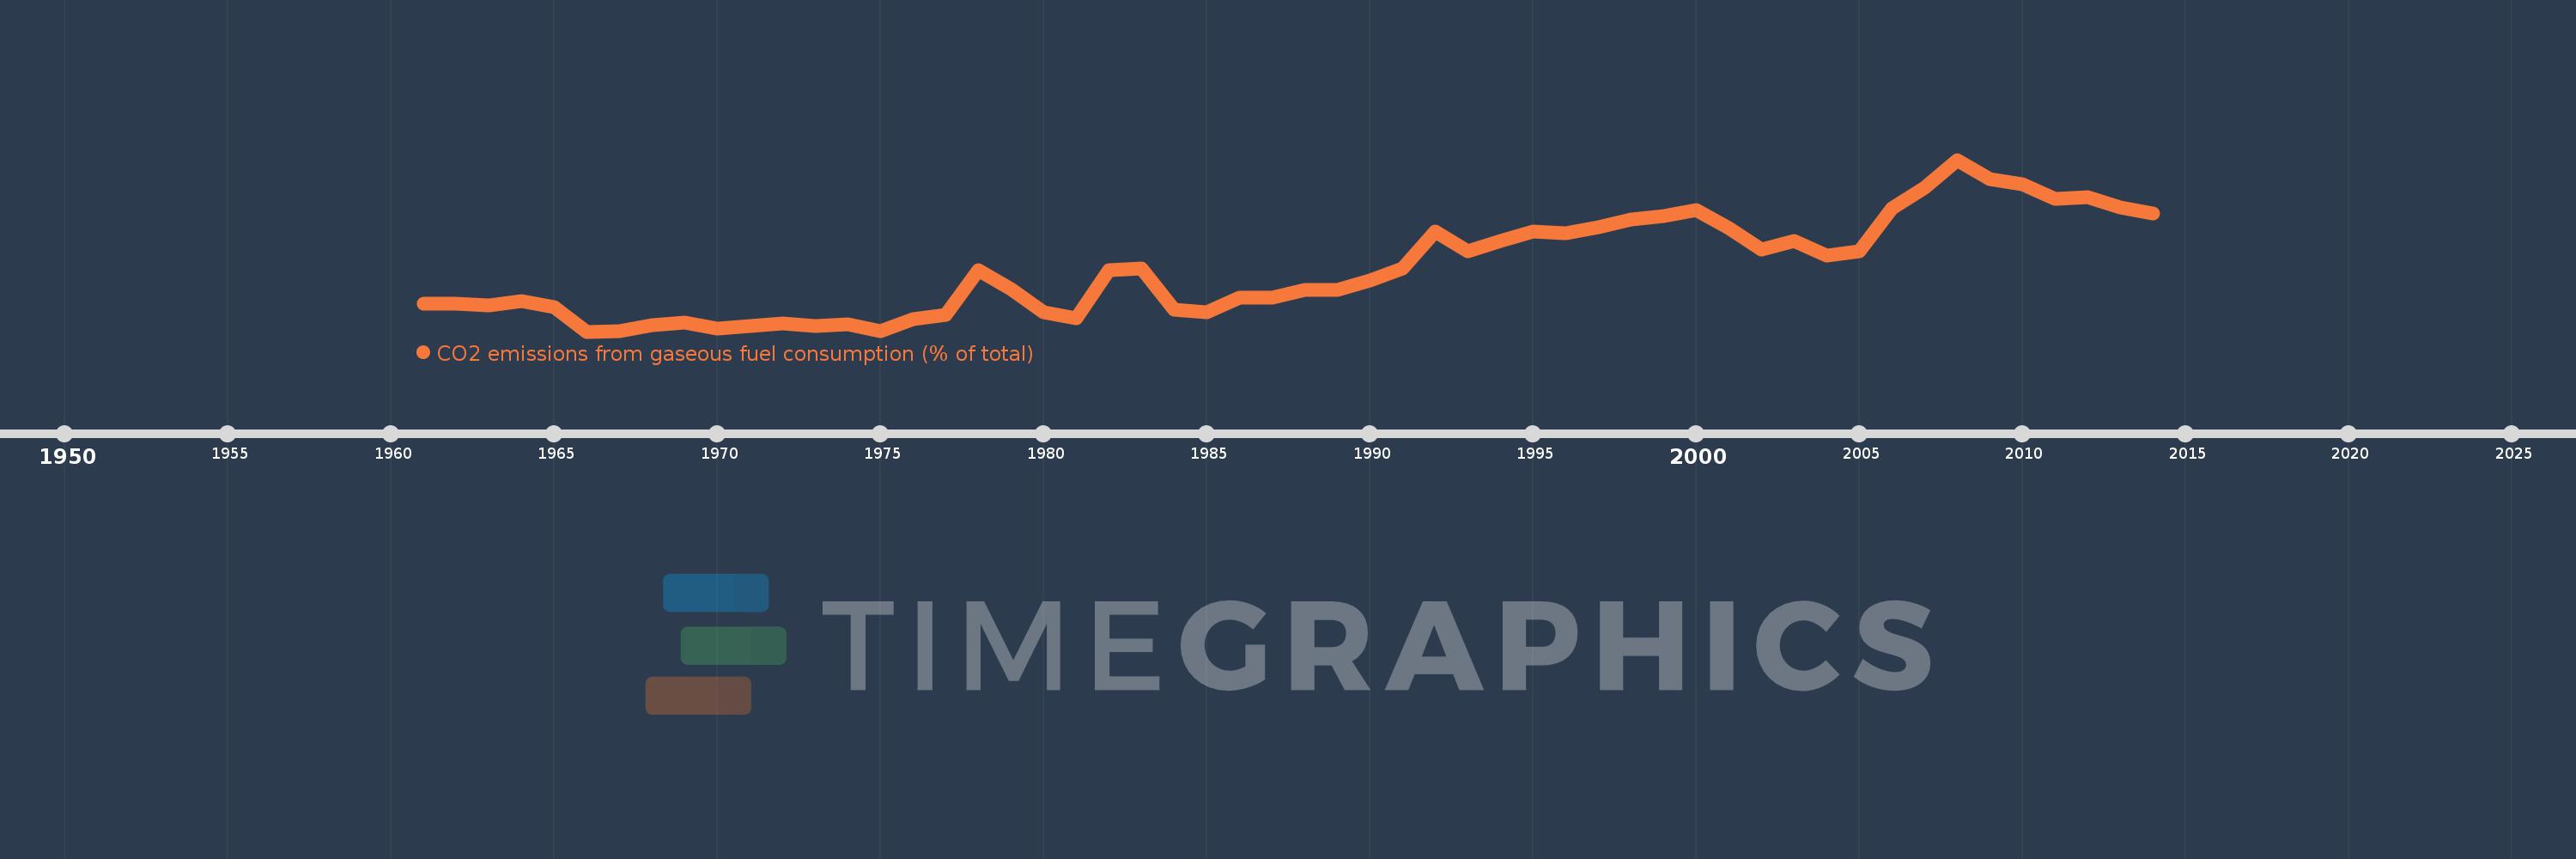
CO2 emissions from gaseous fuel consumption (% of total)
2014,2013,2012,2011,2010,2009,2008,2007,2006,2005,2004,2003,2002,2001,2000,1999,1998,1997,1996,1995,1994,1993,1992,1991,1990,1989,1988,1987,1986,1985,1984,1983,1982,1981,1980,1979,1978,1977,1976,1975,1974,1973,1972,1971,1970,1969,1968,1967,1966,1965,1964,1963,1962,1961
Estas estatísticas em outros países:
AfghanistanAlbaniaAlgeriaAndorraAngolaAntigua and BarbudaArab WorldArgentinaArmeniaArubaAustraliaAustriaAzerbaijanBahamas, TheBahrainBangladeshBarbadosBelarusBelgiumBelizeBeninBermudaBhutanBoliviaBosnia and HerzegovinaBotswanaBrazilBritish Virgin IslandsBrunei DarussalamBulgariaBurkina FasoBurundiCabo VerdeCambodiaCameroonCanadaCaribbean small statesCayman IslandsCentral African RepublicCentral Europe and the BalticsChadChileChinaColombiaComorosCongo, Dem. Rep.Congo, Rep.Costa RicaCote d'IvoireCroatiaCubaCuracaoCyprusCzech RepublicDenmarkDjiboutiDominicaDominican RepublicEarly-demographic dividendEast Asia & PacificEast Asia & Pacific (excluding high income)East Asia & Pacific (IDA & IBRD countries)EcuadorEgypt, Arab Rep.El SalvadorEquatorial GuineaEritreaEstoniaEthiopiaEuro areaEurope & Central AsiaEurope & Central Asia (excluding high income)Europe & Central Asia (IDA & IBRD countries)European UnionFaroe IslandsFijiFinlandFragile and conflict affected situationsFranceFrench PolynesiaGabonGambia, TheGeorgiaGermanyGhanaGibraltarGreeceGreenlandGrenadaGuatemalaGuineaGuinea-BissauGuyanaHaitiHeavily indebted poor countries (HIPC)High incomeHondurasHong Kong SAR, ChinaHungaryIBRD onlyIcelandIDA & IBRD totalIDA blendIDA onlyIDA totalIndiaIndonesiaIran, Islamic Rep.IraqIrelandIsraelItalyJamaicaJapanJordanKazakhstanKenyaKiribatiKorea, Dem. People’s Rep.Korea, Rep.KuwaitKyrgyz RepublicLao PDRLate-demographic dividendLatin America & Caribbean Latin America & Caribbean (excluding high income)Latin America & the Caribbean (IDA & IBRD countries)LatviaLeast developed countries: UN classificationLebanonLesothoLiberiaLibyaLiechtensteinLithuaniaLow & middle incomeLow incomeLower middle incomeLuxembourgMacao SAR, ChinaMacedonia, FYRMadagascarMalawiMalaysiaMaldivesMaliMaltaMarshall IslandsMauritaniaMauritiusMexicoMicronesia, Fed. Sts.Middle East & North AfricaMiddle East & North Africa (excluding high income)Middle East & North Africa (IDA & IBRD countries)Middle incomeMoldovaMongoliaMontenegroMoroccoMozambiqueMyanmarNamibiaNauruNepalNetherlandsNew CaledoniaNew ZealandNicaraguaNigerNigeriaNorth AmericaNorwayOECD membersOmanOther small statesPacific island small statesPakistanPalauPanamaPapua New GuineaParaguayPeruPhilippinesPolandPortugalPost-demographic dividendPre-demographic dividendQatarRomaniaRussian FederationRwandaSamoaSao Tome and PrincipeSaudi ArabiaSenegalSerbiaSeychellesSierra LeoneSingaporeSint Maarten (Dutch part)Slovak RepublicSloveniaSmall statesSolomon IslandsSomaliaSouth AfricaSouth AsiaSouth Asia (IDA & IBRD)South SudanSpainSri LankaSt. Kitts and NevisSt. LuciaSt. Vincent and the GrenadinesSub-Saharan Africa Sub-Saharan Africa (excluding high income)Sub-Saharan Africa (IDA & IBRD countries)SudanSurinameSwazilandSwedenSwitzerlandSyrian Arab RepublicTajikistanTanzaniaThailandTimor-LesteTogoTongaTrinidad and TobagoTunisiaTurkeyTurkmenistanTurks and Caicos IslandsUgandaUkraineUnited Arab EmiratesUnited KingdomUnited StatesUpper middle incomeUruguayUzbekistanVanuatuVenezuela, RBVietnamWest Bank and GazaWorldYemen, Rep.ZambiaZimbabwe Linha do tempo:
Nesta escala de tempo está apresentado um gráfico de 1961 ano até 2014 ano Pre-demographic dividend. Dados de 1960 ano ausente. O número de observações reais por data: 54.
Fonte (nome):
Indicadores de desenvolvimento mundial
Fonte (organização):
Carbon Dioxide Information Analysis Center, Environmental Sciences Division, Oak Ridge National Laboratory, Tennessee, United States.
Categorias:
Energy & Mining, Climate Change, Environment
Foi atualizado:
23 abr 2017 ano
Indicadores de alterações dos valores ao longo dos anos
Mínimo:
2.053
1 jan 1966 ano
Máximo:
16.575
1 jan 2008 ano
Na data de observação
Valor
Mudança absoluta
A alteração em relação ao valor anterior
1 jan 1961 ano
4.438
+4.438
0.0%
1 jan 1962 ano
4.397
-0.041
-0.91%
1 jan 1963 ano
4.26
-0.137
-3.13%
1 jan 1964 ano
4.634
+0.375
8.8%
1 jan 1965 ano
4.125
-0.51
-11.0%
1 jan 1966 ano
2.053
-2.072
-50.23%
1 jan 1967 ano
2.075
+0.023
1.11%
1 jan 1968 ano
2.572
+0.497
23.94%
1 jan 1969 ano
2.78
+0.207
8.06%
1 jan 1970 ano
2.277
-0.502
-18.07%
1 jan 1971 ano
2.526
+0.249
10.93%
1 jan 1972 ano
2.738
+0.212
8.38%
1 jan 1973 ano
2.542
-0.195
-7.14%
1 jan 1974 ano
2.694
+0.151
5.94%
1 jan 1975 ano
2.059
-0.635
-23.57%
1 jan 1976 ano
3.07
+1.011
49.11%
1 jan 1977 ano
3.47
+0.401
13.06%
1 jan 1978 ano
7.218
+3.747
107.98%
1 jan 1979 ano
5.623
-1.595
-22.1%
1 jan 1980 ano
3.704
-1.918
-34.12%
1 jan 1981 ano
3.177
-0.527
-14.24%
1 jan 1982 ano
7.262
+4.085
128.59%
1 jan 1983 ano
7.42
+0.158
2.18%
1 jan 1984 ano
3.884
-3.536
-47.65%
1 jan 1985 ano
3.716
-0.169
-4.34%
1 jan 1986 ano
4.945
+1.23
33.09%
1 jan 1987 ano
4.948
+0.003
0.06%
1 jan 1988 ano
5.6
+0.652
13.18%
1 jan 1989 ano
5.56
-0.04
-0.72%
1 jan 1990 ano
6.349
+0.789
14.18%
1 jan 1991 ano
7.378
+1.03
16.22%
1 jan 1992 ano
10.48
+3.101
42.03%
1 jan 1993 ano
8.876
-1.604
-15.3%
1 jan 1994 ano
9.682
+0.806
9.08%
1 jan 1995 ano
10.514
+0.832
8.59%
1 jan 1996 ano
10.352
-0.162
-1.54%
1 jan 1997 ano
10.884
+0.533
5.15%
1 jan 1998 ano
11.561
+0.677
6.22%
1 jan 1999 ano
11.816
+0.254
2.2%
1 jan 2000 ano
12.307
+0.492
4.16%
1 jan 2001 ano
10.807
-1.501
-12.19%
1 jan 2002 ano
8.957
-1.85
-17.12%
1 jan 2003 ano
9.715
+0.759
8.47%
1 jan 2004 ano
8.479
-1.237
-12.73%
1 jan 2005 ano
8.856
+0.378
4.45%
1 jan 2006 ano
12.492
+3.636
41.05%
1 jan 2007 ano
14.246
+1.754
14.04%
1 jan 2008 ano
16.575
+2.329
16.35%
1 jan 2009 ano
14.907
-1.668
-10.07%
1 jan 2010 ano
14.475
-0.432
-2.9%
1 jan 2011 ano
13.301
-1.174
-8.11%
1 jan 2012 ano
13.387
+0.086
0.65%
1 jan 2013 ano
12.571
-0.816
-6.1%
1 jan 2014 ano
12.017
-0.554
-4.41%
Classificação de países por estatísticas atuais por anos


Comentários: