29
/pt/
pt
AIzaSyAYiBZKx7MnpbEhh9jyipgxe19OcubqV5w
April 1, 2024
132952
Finland
FIN
true
2
1
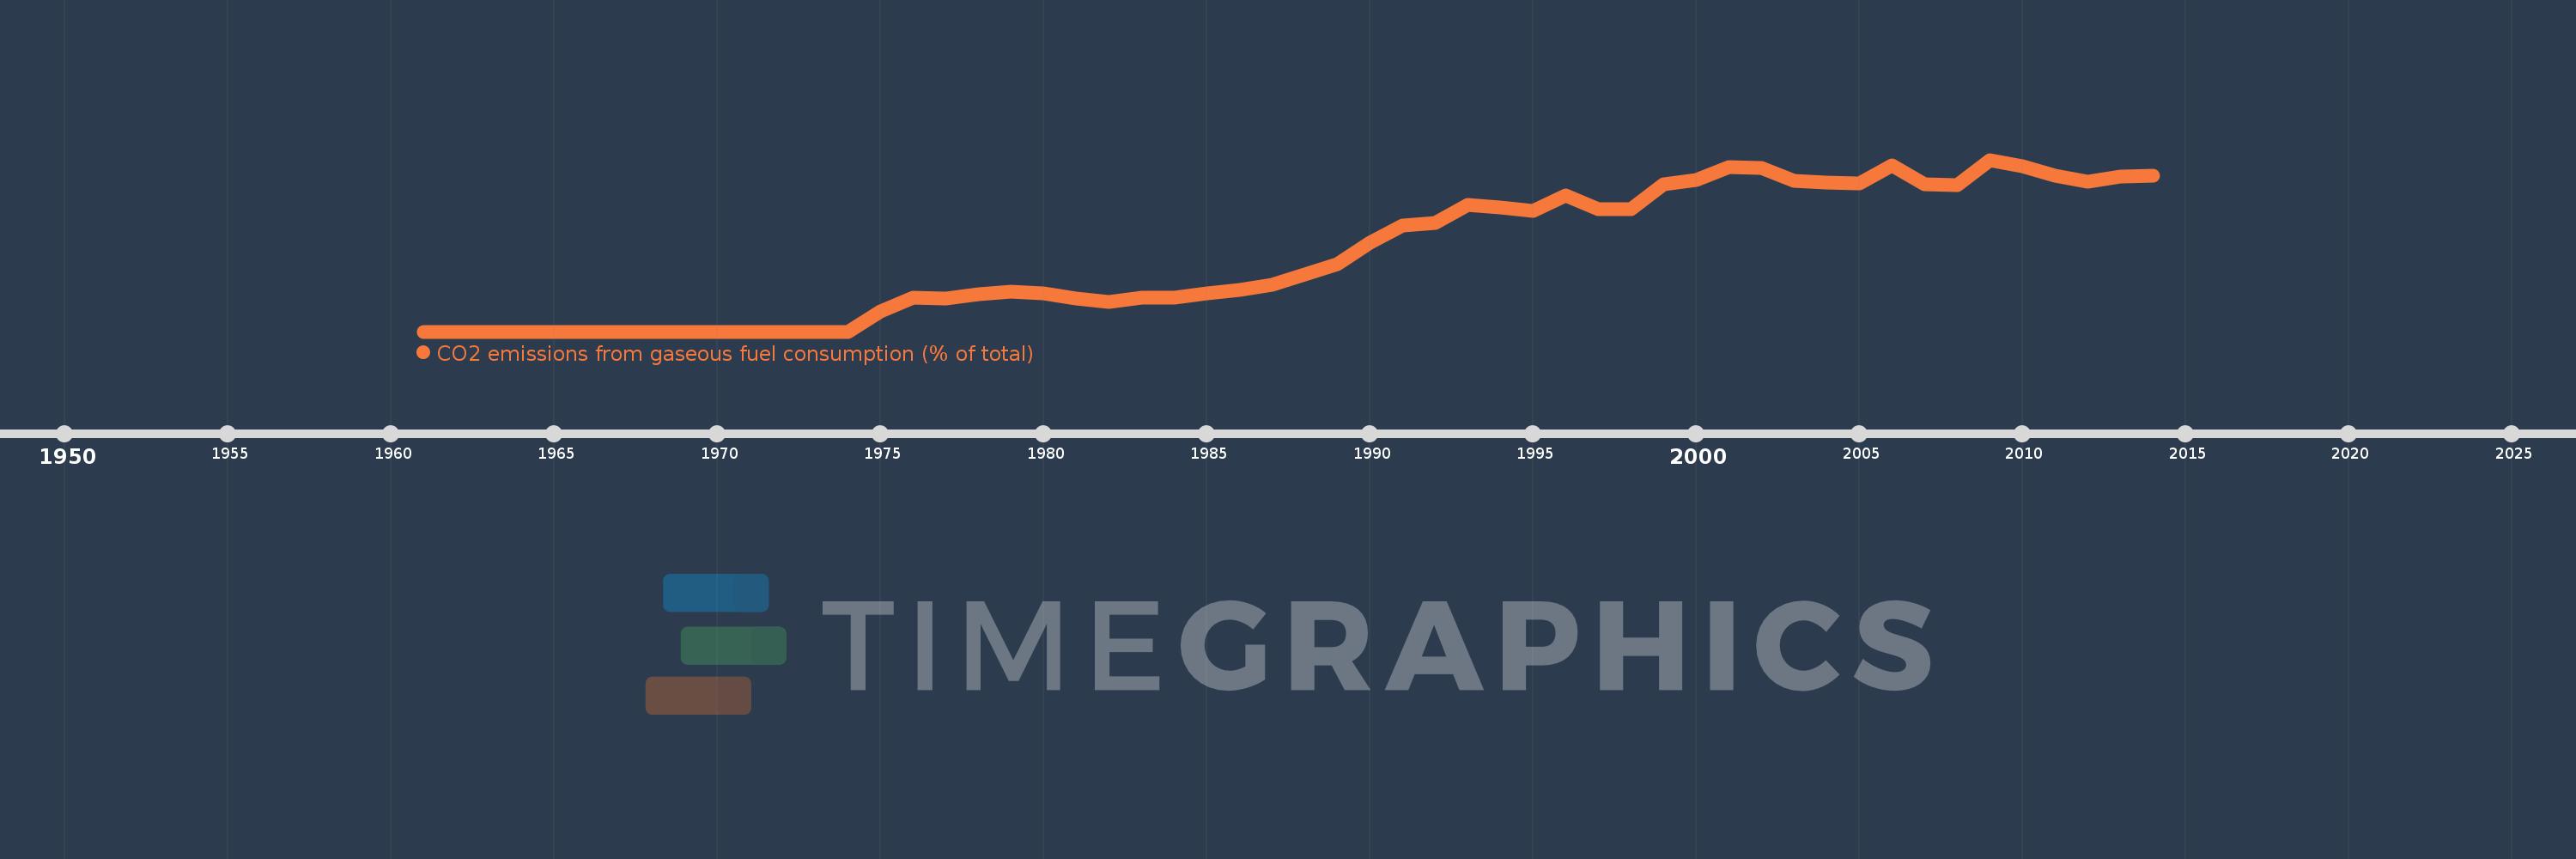
CO2 emissions from gaseous fuel consumption (% of total)
2014,2013,2012,2011,2010,2009,2008,2007,2006,2005,2004,2003,2002,2001,2000,1999,1998,1997,1996,1995,1994,1993,1992,1991,1990,1989,1988,1987,1986,1985,1984,1983,1982,1981,1980,1979,1978,1977,1976,1975,1974,1973,1972,1971,1970,1969,1968,1967,1966,1965,1964,1963,1962,1961
Estas estatísticas em outros países:
AfghanistanAlbaniaAlgeriaAndorraAngolaAntigua and BarbudaArab WorldArgentinaArmeniaArubaAustraliaAustriaAzerbaijanBahamas, TheBahrainBangladeshBarbadosBelarusBelgiumBelizeBeninBermudaBhutanBoliviaBosnia and HerzegovinaBotswanaBrazilBritish Virgin IslandsBrunei DarussalamBulgariaBurkina FasoBurundiCabo VerdeCambodiaCameroonCanadaCaribbean small statesCayman IslandsCentral African RepublicCentral Europe and the BalticsChadChileChinaColombiaComorosCongo, Dem. Rep.Congo, Rep.Costa RicaCote d'IvoireCroatiaCubaCuracaoCyprusCzech RepublicDenmarkDjiboutiDominicaDominican RepublicEarly-demographic dividendEast Asia & PacificEast Asia & Pacific (excluding high income)East Asia & Pacific (IDA & IBRD countries)EcuadorEgypt, Arab Rep.El SalvadorEquatorial GuineaEritreaEstoniaEthiopiaEuro areaEurope & Central AsiaEurope & Central Asia (excluding high income)Europe & Central Asia (IDA & IBRD countries)European UnionFaroe IslandsFijiFinlandFragile and conflict affected situationsFranceFrench PolynesiaGabonGambia, TheGeorgiaGermanyGhanaGibraltarGreeceGreenlandGrenadaGuatemalaGuineaGuinea-BissauGuyanaHaitiHeavily indebted poor countries (HIPC)High incomeHondurasHong Kong SAR, ChinaHungaryIBRD onlyIcelandIDA & IBRD totalIDA blendIDA onlyIDA totalIndiaIndonesiaIran, Islamic Rep.IraqIrelandIsraelItalyJamaicaJapanJordanKazakhstanKenyaKiribatiKorea, Dem. People’s Rep.Korea, Rep.KuwaitKyrgyz RepublicLao PDRLate-demographic dividendLatin America & Caribbean Latin America & Caribbean (excluding high income)Latin America & the Caribbean (IDA & IBRD countries)LatviaLeast developed countries: UN classificationLebanonLesothoLiberiaLibyaLiechtensteinLithuaniaLow & middle incomeLow incomeLower middle incomeLuxembourgMacao SAR, ChinaMacedonia, FYRMadagascarMalawiMalaysiaMaldivesMaliMaltaMarshall IslandsMauritaniaMauritiusMexicoMicronesia, Fed. Sts.Middle East & North AfricaMiddle East & North Africa (excluding high income)Middle East & North Africa (IDA & IBRD countries)Middle incomeMoldovaMongoliaMontenegroMoroccoMozambiqueMyanmarNamibiaNauruNepalNetherlandsNew CaledoniaNew ZealandNicaraguaNigerNigeriaNorth AmericaNorwayOECD membersOmanOther small statesPacific island small statesPakistanPalauPanamaPapua New GuineaParaguayPeruPhilippinesPolandPortugalPost-demographic dividendPre-demographic dividendQatarRomaniaRussian FederationRwandaSamoaSao Tome and PrincipeSaudi ArabiaSenegalSerbiaSeychellesSierra LeoneSingaporeSint Maarten (Dutch part)Slovak RepublicSloveniaSmall statesSolomon IslandsSomaliaSouth AfricaSouth AsiaSouth Asia (IDA & IBRD)South SudanSpainSri LankaSt. Kitts and NevisSt. LuciaSt. Vincent and the GrenadinesSub-Saharan Africa Sub-Saharan Africa (excluding high income)Sub-Saharan Africa (IDA & IBRD countries)SudanSurinameSwazilandSwedenSwitzerlandSyrian Arab RepublicTajikistanTanzaniaThailandTimor-LesteTogoTongaTrinidad and TobagoTunisiaTurkeyTurkmenistanTurks and Caicos IslandsUgandaUkraineUnited Arab EmiratesUnited KingdomUnited StatesUpper middle incomeUruguayUzbekistanVanuatuVenezuela, RBVietnamWest Bank and GazaWorldYemen, Rep.ZambiaZimbabwe Linha do tempo:
Nesta escala de tempo está apresentado um gráfico de 1961 ano até 2014 ano Finland. Dados de 1960 ano ausente. O número de observações reais por data: 54.
Fonte (nome):
Indicadores de desenvolvimento mundial
Fonte (organização):
Carbon Dioxide Information Analysis Center, Environmental Sciences Division, Oak Ridge National Laboratory, Tennessee, United States.
Categorias:
Energy & Mining, Climate Change, Environment
Foi atualizado:
23 abr 2017 ano
Indicadores de alterações dos valores ao longo dos anos
Máximo:
15.61
1 jan 2009 ano
Na data de observação
Valor
Mudança absoluta
A alteração em relação ao valor anterior
1 jan 1961 ano
0.0
0.0
0.0%
1 jan 1975 ano
1.862
+1.862
%
1 jan 1976 ano
3.078
+1.217
65.34%
1 jan 1977 ano
2.975
-0.103
-3.36%
1 jan 1978 ano
3.425
+0.45
15.12%
1 jan 1979 ano
3.602
+0.178
5.19%
1 jan 1980 ano
3.462
-0.14
-3.89%
1 jan 1981 ano
3.035
-0.428
-12.35%
1 jan 1982 ano
2.727
-0.308
-10.15%
1 jan 1983 ano
3.073
+0.346
12.69%
1 jan 1984 ano
3.087
+0.014
0.47%
1 jan 1985 ano
3.463
+0.376
12.17%
1 jan 1986 ano
3.751
+0.288
8.32%
1 jan 1987 ano
4.243
+0.492
13.11%
1 jan 1988 ano
5.196
+0.954
22.48%
1 jan 1989 ano
6.149
+0.952
18.33%
1 jan 1990 ano
8.11
+1.962
31.9%
1 jan 1991 ano
9.659
+1.549
19.1%
1 jan 1992 ano
9.84
+0.181
1.87%
1 jan 1993 ano
11.54
+1.7
17.28%
1 jan 1994 ano
11.284
-0.256
-2.22%
1 jan 1995 ano
10.99
-0.294
-2.61%
1 jan 1996 ano
12.334
+1.344
12.23%
1 jan 1997 ano
11.088
-1.246
-10.1%
1 jan 1998 ano
11.105
+0.017
0.15%
1 jan 1999 ano
13.403
+2.298
20.7%
1 jan 2000 ano
13.795
+0.392
2.92%
1 jan 2001 ano
14.947
+1.152
8.35%
1 jan 2002 ano
14.88
-0.067
-0.45%
1 jan 2003 ano
13.679
-1.2
-8.07%
1 jan 2004 ano
13.532
-0.148
-1.08%
1 jan 2005 ano
13.484
-0.048
-0.35%
1 jan 2006 ano
15.079
+1.595
11.83%
1 jan 2007 ano
13.411
-1.668
-11.06%
1 jan 2008 ano
13.325
-0.086
-0.64%
1 jan 2009 ano
15.61
+2.286
17.15%
1 jan 2010 ano
15.013
-0.597
-3.83%
1 jan 2011 ano
14.198
-0.815
-5.43%
1 jan 2012 ano
13.59
-0.608
-4.28%
1 jan 2013 ano
14.097
+0.507
3.73%
1 jan 2014 ano
14.13
+0.033
0.23%
Classificação de países por estatísticas atuais por anos


Comentários: