29
/pt/
pt
AIzaSyAYiBZKx7MnpbEhh9jyipgxe19OcubqV5w
April 1, 2024
77360
Bahrain
BHR
true
2
1
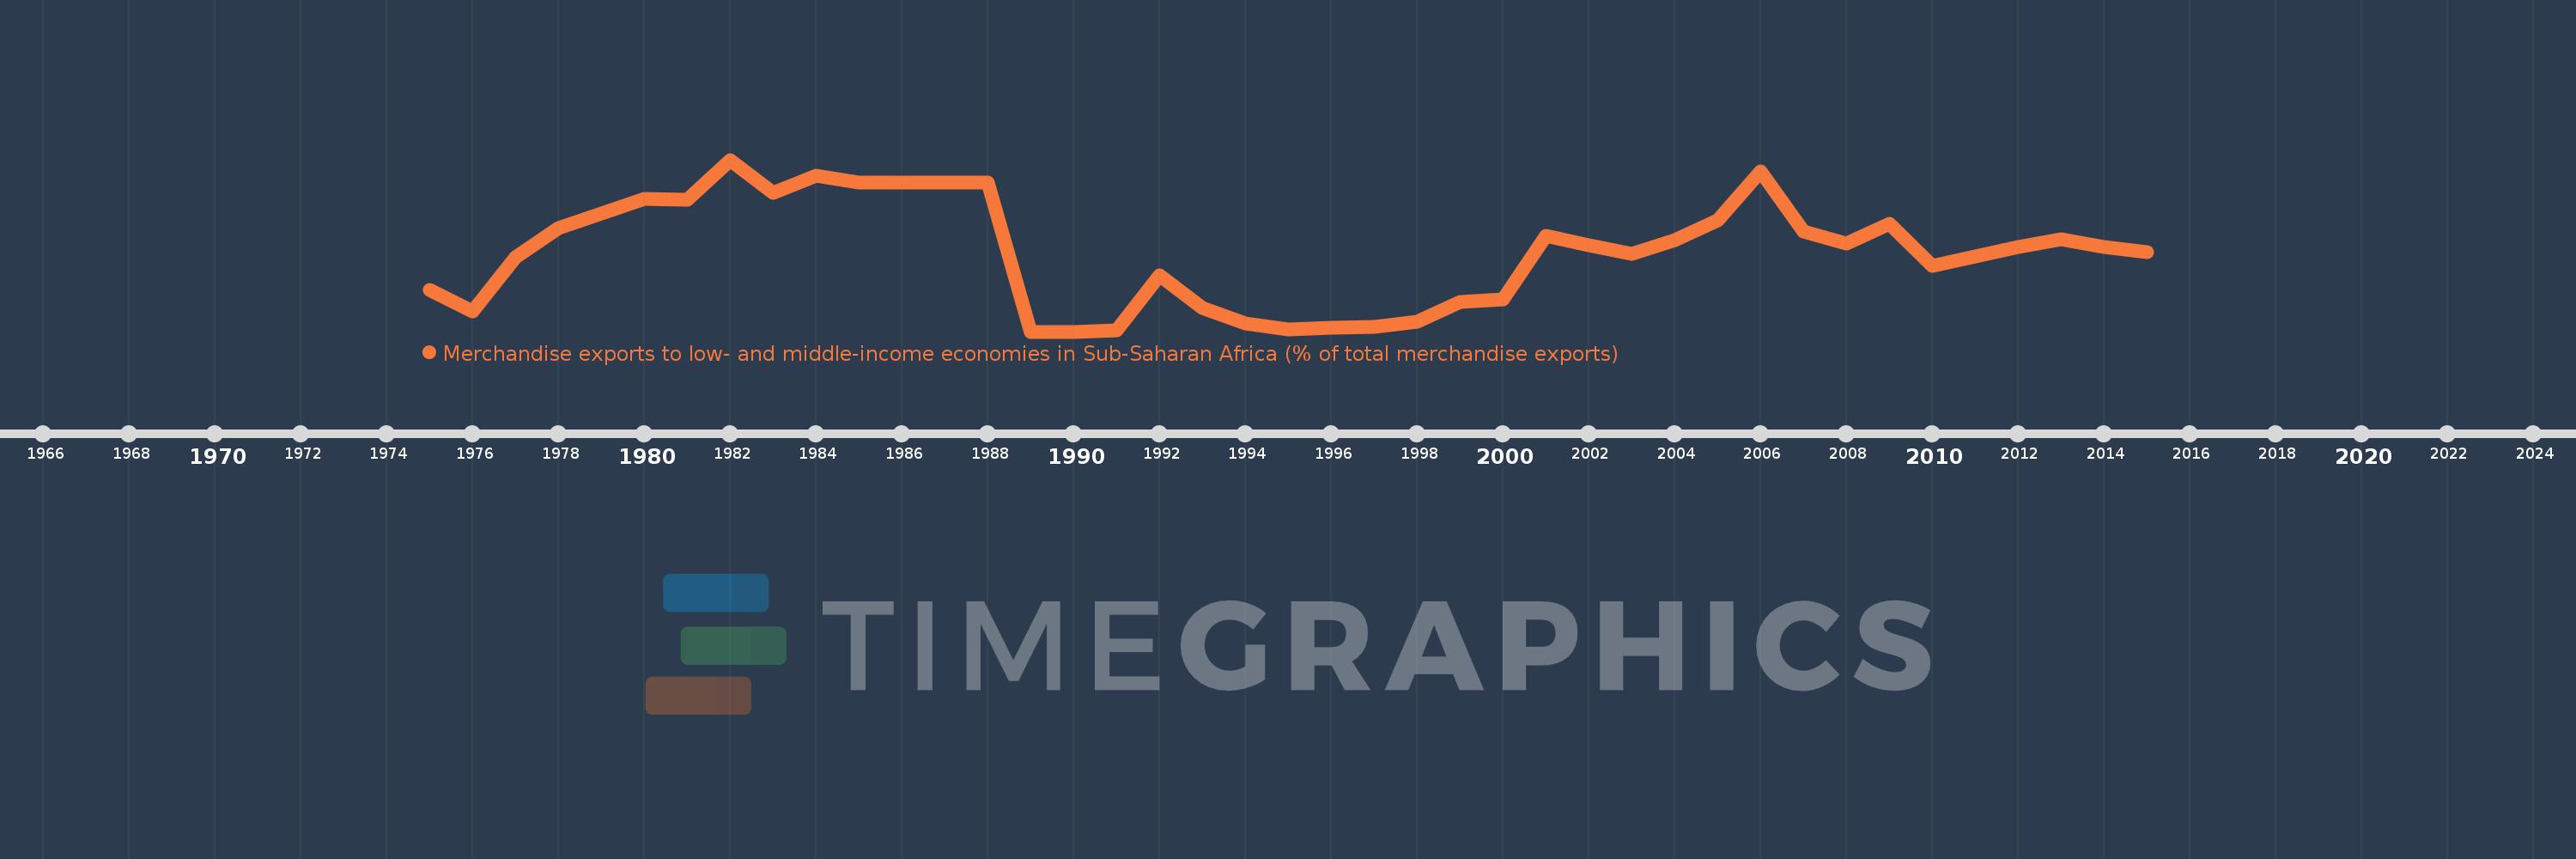
Merchandise exports to low- and middle-income economies in Sub-Saharan Africa (% of total merchandise exports)
2015,2014,2013,2012,2011,2010,2009,2008,2007,2006,2005,2004,2003,2002,2001,2000,1999,1998,1997,1996,1995,1994,1993,1992,1991,1990,1989,1988,1987,1986,1985,1984,1983,1982,1981,1980,1978,1977,1976,1975
Estas estatísticas em outros países:
AfghanistanAlbaniaAlgeriaAngolaArab WorldArgentinaArmeniaAustraliaAustriaAzerbaijanBahamas, TheBahrainBangladeshBarbadosBelarusBelgiumBelizeBeninBermudaBoliviaBrazilBulgariaBurkina FasoBurundiCabo VerdeCambodiaCameroonCanadaCaribbean small statesCentral African RepublicCentral Europe and the BalticsChadChileChinaColombiaCongo, Dem. Rep.Congo, Rep.Costa RicaCote d'IvoireCroatiaCubaCyprusCzech RepublicDenmarkDjiboutiDominicaDominican RepublicEarly-demographic dividendEast Asia & PacificEast Asia & Pacific (excluding high income)East Asia & Pacific (IDA & IBRD countries)EcuadorEgypt, Arab Rep.EstoniaEthiopiaEuro areaEurope & Central AsiaEurope & Central Asia (excluding high income)Europe & Central Asia (IDA & IBRD countries)European UnionFijiFinlandFragile and conflict affected situationsFranceGabonGambia, TheGeorgiaGermanyGhanaGibraltarGreeceGreenlandGuatemalaGuineaGuinea-BissauGuyanaHaitiHeavily indebted poor countries (HIPC)High incomeHondurasHong Kong SAR, ChinaHungaryIBRD onlyIcelandIDA & IBRD totalIDA blendIDA onlyIDA totalIndiaIndonesiaIran, Islamic Rep.IraqIrelandIsraelItalyJamaicaJapanJordanKazakhstanKenyaKorea, Dem. People’s Rep.Korea, Rep.KuwaitLao PDRLate-demographic dividendLatin America & Caribbean Latin America & Caribbean (excluding high income)Latin America & the Caribbean (IDA & IBRD countries)LatviaLeast developed countries: UN classificationLebanonLiberiaLibyaLithuaniaLow & middle incomeLow incomeLower middle incomeLuxembourgMacao SAR, ChinaMacedonia, FYRMadagascarMalawiMalaysiaMaliMaltaMauritaniaMauritiusMexicoMiddle East & North AfricaMiddle East & North Africa (excluding high income)Middle East & North Africa (IDA & IBRD countries)Middle incomeMoldovaMontenegroMoroccoMozambiqueMyanmarNetherlandsNew ZealandNicaraguaNigerNigeriaNorth AmericaNorwayOECD membersOmanOther small statesPacific island small statesPakistanPanamaPapua New GuineaParaguayPeruPhilippinesPolandPortugalPost-demographic dividendPre-demographic dividendQatarRomaniaRussian FederationRwandaSaudi ArabiaSenegalSerbiaSeychellesSierra LeoneSingaporeSlovak RepublicSloveniaSmall statesSomaliaSouth AfricaSouth AsiaSouth Asia (IDA & IBRD)SpainSri LankaSt. LuciaSt. Vincent and the GrenadinesSub-Saharan Africa Sub-Saharan Africa (excluding high income)Sub-Saharan Africa (IDA & IBRD countries)SudanSurinameSwedenSwitzerlandSyrian Arab RepublicTanzaniaThailandTogoTrinidad and TobagoTunisiaTurkeyUgandaUkraineUnited Arab EmiratesUnited KingdomUnited StatesUpper middle incomeUruguayVenezuela, RBVietnamWorldYemen, Rep.ZambiaZimbabwe Linha do tempo:
Nesta escala de tempo está apresentado um gráfico de 1975 ano até 2015 ano Bahrain. Dados de 1974 ano ausente. O número de observações reais por data: 40.
Fonte (nome):
Indicadores de desenvolvimento mundial
Fonte (organização):
World Bank staff estimates based data from International Monetary Fund's Direction of Trade database.
Categorias:
Private Sector, Trade
Foi atualizado:
23 abr 2017 ano
Indicadores de alterações dos valores ao longo dos anos
Mínimo:
0.029
1 jan 1990 ano
Máximo:
6.792
1 jan 1982 ano
Na data de observação
Valor
Mudança absoluta
A alteração em relação ao valor anterior
1 jan 1975 ano
1.677
+1.677
0.0%
1 jan 1976 ano
0.819
-0.859
-51.18%
1 jan 1977 ano
2.941
+2.122
259.16%
1 jan 1978 ano
4.108
+1.167
39.68%
1 jan 1980 ano
5.25
+1.142
27.79%
1 jan 1981 ano
5.222
-0.028
-0.53%
1 jan 1982 ano
6.792
+1.57
30.07%
1 jan 1983 ano
5.489
-1.303
-19.19%
1 jan 1984 ano
6.156
+0.667
12.15%
1 jan 1985 ano
5.907
-0.25
-4.06%
1 jan 1986 ano
5.907
0.0
0.0%
1 jan 1987 ano
5.907
+0.0
0.0%
1 jan 1988 ano
5.907
+0.0
0.0%
1 jan 1989 ano
0.029
-5.878
-99.51%
1 jan 1990 ano
0.029
0.0
0.0%
1 jan 1991 ano
0.065
+0.037
127.62%
1 jan 1992 ano
2.24
+2.175
3.32 mil%
1 jan 1993 ano
0.954
-1.286
-57.4%
1 jan 1994 ano
0.364
-0.59
-61.87%
1 jan 1995 ano
0.116
-0.247
-68.01%
1 jan 1996 ano
0.186
+0.07
59.79%
1 jan 1997 ano
0.209
+0.023
12.23%
1 jan 1998 ano
0.426
+0.217
103.97%
1 jan 1999 ano
1.185
+0.759
178.29%
1 jan 2000 ano
1.282
+0.097
8.19%
1 jan 2001 ano
3.81
+2.528
197.25%
1 jan 2002 ano
3.432
-0.378
-9.91%
1 jan 2003 ano
3.095
-0.337
-9.83%
1 jan 2004 ano
3.636
+0.541
17.47%
1 jan 2005 ano
4.412
+0.777
21.37%
1 jan 2006 ano
6.319
+1.907
43.21%
1 jan 2007 ano
3.976
-2.343
-37.08%
1 jan 2008 ano
3.51
-0.466
-11.72%
1 jan 2009 ano
4.271
+0.761
21.67%
1 jan 2010 ano
2.627
-1.643
-38.48%
1 jan 2011 ano
2.975
+0.347
13.22%
1 jan 2012 ano
3.355
+0.381
12.8%
1 jan 2013 ano
3.652
+0.297
8.85%
1 jan 2014 ano
3.343
-0.309
-8.47%
1 jan 2015 ano
3.148
-0.195
-5.83%
Classificação de países por estatísticas atuais por anos


Comentários: