29
/pt/
pt
AIzaSyAYiBZKx7MnpbEhh9jyipgxe19OcubqV5w
April 1, 2024
269619
Turkey
TUR
true
2
1
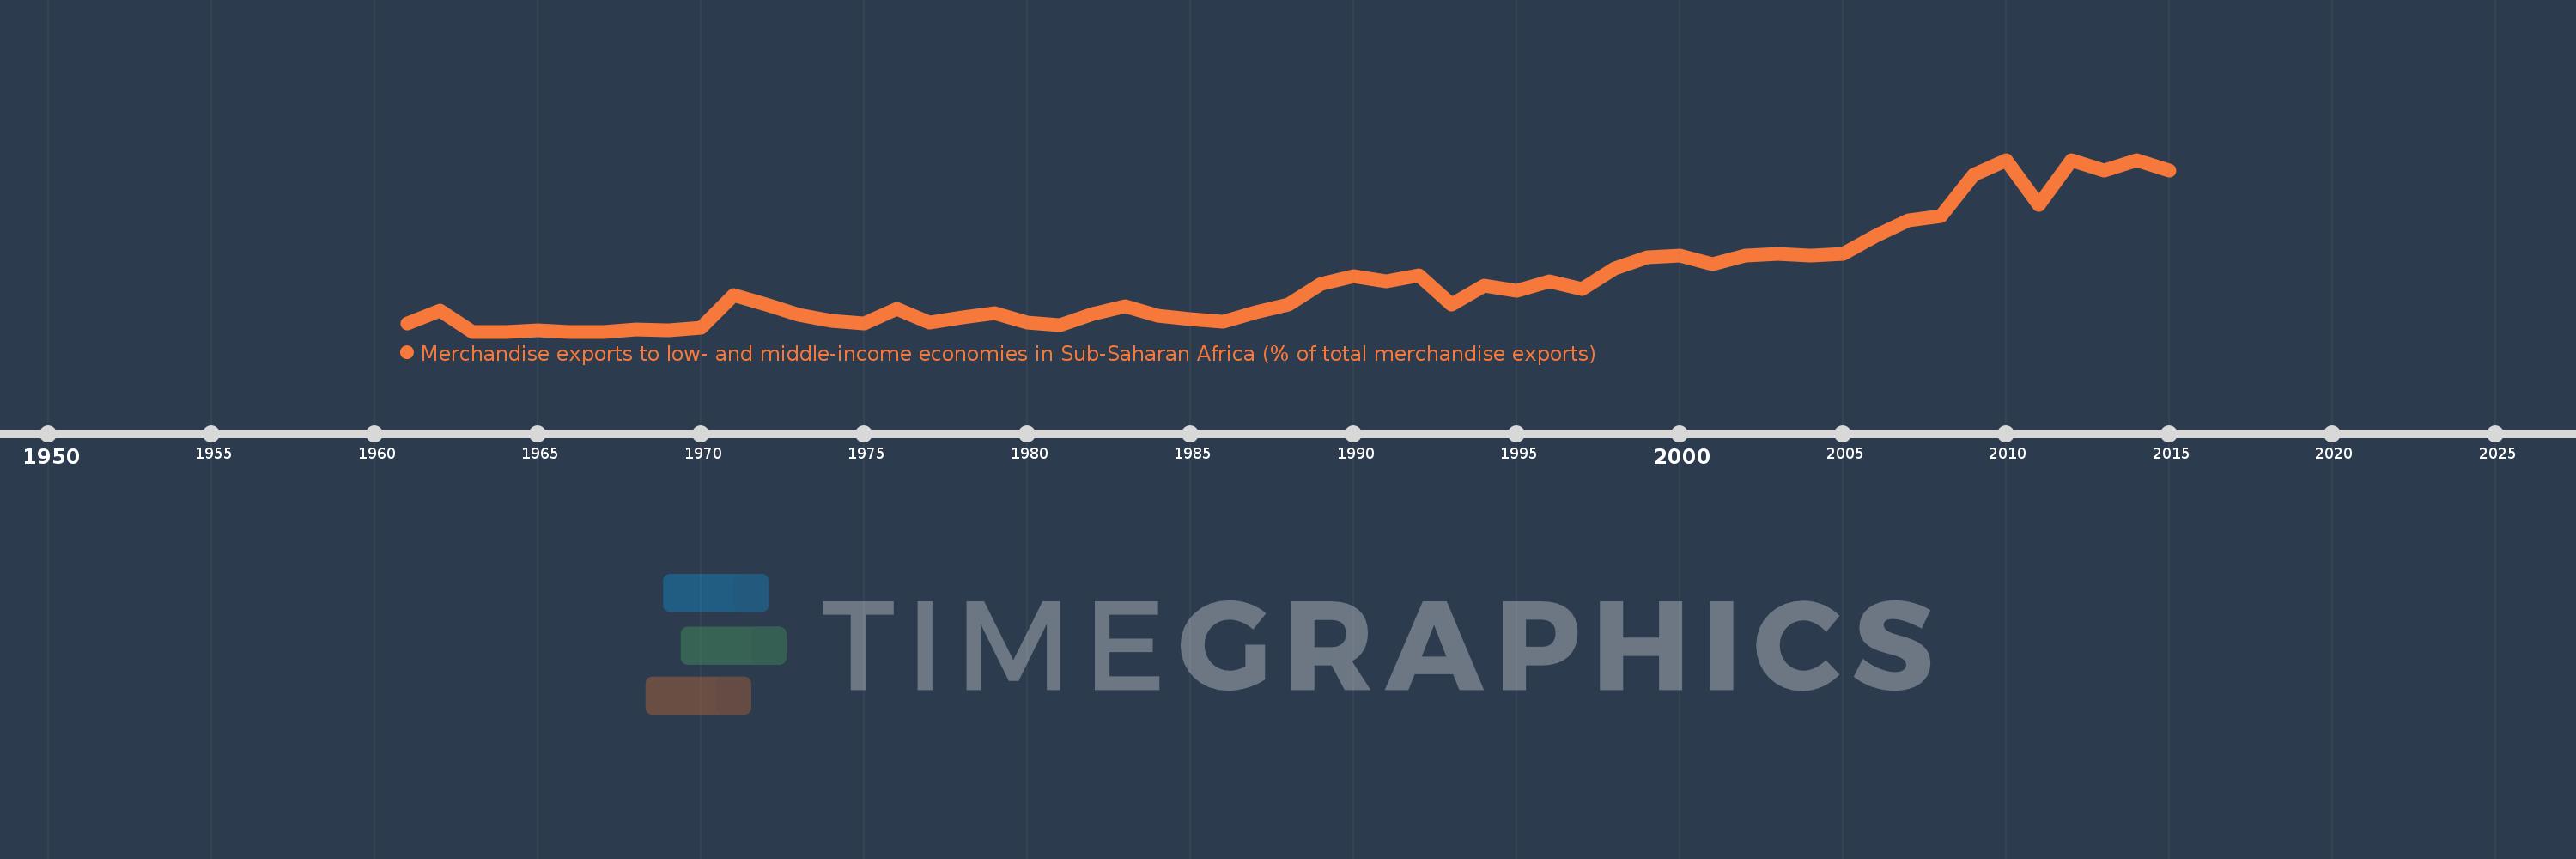
Merchandise exports to low- and middle-income economies in Sub-Saharan Africa (% of total merchandise exports)
2015,2014,2013,2012,2011,2010,2009,2008,2007,2006,2005,2004,2003,2002,2001,2000,1999,1998,1997,1996,1995,1994,1993,1992,1991,1990,1989,1988,1987,1986,1985,1984,1983,1982,1981,1980,1979,1978,1977,1976,1975,1974,1973,1972,1971,1970,1969,1968,1967,1966,1965,1964,1963,1962,1961
Estas estatísticas em outros países:
AfghanistanAlbaniaAlgeriaAngolaArab WorldArgentinaArmeniaAustraliaAustriaAzerbaijanBahamas, TheBahrainBangladeshBarbadosBelarusBelgiumBelizeBeninBermudaBoliviaBrazilBulgariaBurkina FasoBurundiCabo VerdeCambodiaCameroonCanadaCaribbean small statesCentral African RepublicCentral Europe and the BalticsChadChileChinaColombiaCongo, Dem. Rep.Congo, Rep.Costa RicaCote d'IvoireCroatiaCubaCyprusCzech RepublicDenmarkDjiboutiDominicaDominican RepublicEarly-demographic dividendEast Asia & PacificEast Asia & Pacific (excluding high income)East Asia & Pacific (IDA & IBRD countries)EcuadorEgypt, Arab Rep.EstoniaEthiopiaEuro areaEurope & Central AsiaEurope & Central Asia (excluding high income)Europe & Central Asia (IDA & IBRD countries)European UnionFijiFinlandFragile and conflict affected situationsFranceGabonGambia, TheGeorgiaGermanyGhanaGibraltarGreeceGreenlandGuatemalaGuineaGuinea-BissauGuyanaHaitiHeavily indebted poor countries (HIPC)High incomeHondurasHong Kong SAR, ChinaHungaryIBRD onlyIcelandIDA & IBRD totalIDA blendIDA onlyIDA totalIndiaIndonesiaIran, Islamic Rep.IraqIrelandIsraelItalyJamaicaJapanJordanKazakhstanKenyaKorea, Dem. People’s Rep.Korea, Rep.KuwaitLao PDRLate-demographic dividendLatin America & Caribbean Latin America & Caribbean (excluding high income)Latin America & the Caribbean (IDA & IBRD countries)LatviaLeast developed countries: UN classificationLebanonLiberiaLibyaLithuaniaLow & middle incomeLow incomeLower middle incomeLuxembourgMacao SAR, ChinaMacedonia, FYRMadagascarMalawiMalaysiaMaliMaltaMauritaniaMauritiusMexicoMiddle East & North AfricaMiddle East & North Africa (excluding high income)Middle East & North Africa (IDA & IBRD countries)Middle incomeMoldovaMontenegroMoroccoMozambiqueMyanmarNetherlandsNew ZealandNicaraguaNigerNigeriaNorth AmericaNorwayOECD membersOmanOther small statesPacific island small statesPakistanPanamaPapua New GuineaParaguayPeruPhilippinesPolandPortugalPost-demographic dividendPre-demographic dividendQatarRomaniaRussian FederationRwandaSaudi ArabiaSenegalSerbiaSeychellesSierra LeoneSingaporeSlovak RepublicSloveniaSmall statesSomaliaSouth AfricaSouth AsiaSouth Asia (IDA & IBRD)SpainSri LankaSt. LuciaSt. Vincent and the GrenadinesSub-Saharan Africa Sub-Saharan Africa (excluding high income)Sub-Saharan Africa (IDA & IBRD countries)SudanSurinameSwedenSwitzerlandSyrian Arab RepublicTanzaniaThailandTogoTrinidad and TobagoTunisiaTurkeyUgandaUkraineUnited Arab EmiratesUnited KingdomUnited StatesUpper middle incomeUruguayVenezuela, RBVietnamWorldYemen, Rep.ZambiaZimbabwe Linha do tempo:
Nesta escala de tempo está apresentado um gráfico de 1961 ano até 2015 ano Turkey. Dados de 1960 ano ausente. O número de observações reais por data: 55.
Fonte (nome):
Indicadores de desenvolvimento mundial
Fonte (organização):
World Bank staff estimates based data from International Monetary Fund's Direction of Trade database.
Categorias:
Private Sector, Trade
Foi atualizado:
23 abr 2017 ano
Indicadores de alterações dos valores ao longo dos anos
Máximo:
2.61
1 jan 2010 ano
Na data de observação
Valor
Mudança absoluta
A alteração em relação ao valor anterior
1 jan 1961 ano
0.125
+0.125
0.0%
1 jan 1962 ano
0.317
+0.192
152.81%
1 jan 1963 ano
0.0
-0.317
-100.0%
1 jan 1965 ano
0.024
+0.024
%
1 jan 1966 ano
0.0
-0.024
-100.0%
1 jan 1968 ano
0.038
+0.038
%
1 jan 1969 ano
0.02
-0.018
-47.32%
1 jan 1970 ano
0.065
+0.045
223.24%
1 jan 1971 ano
0.557
+0.492
755.07%
1 jan 1972 ano
0.417
-0.141
-25.22%
1 jan 1973 ano
0.25
-0.167
-40.03%
1 jan 1974 ano
0.163
-0.087
-34.66%
1 jan 1975 ano
0.127
-0.037
-22.46%
1 jan 1976 ano
0.348
+0.221
174.52%
1 jan 1977 ano
0.136
-0.212
-60.96%
1 jan 1978 ano
0.212
+0.076
55.98%
1 jan 1979 ano
0.282
+0.071
33.37%
1 jan 1980 ano
0.135
-0.147
-52.17%
1 jan 1981 ano
0.104
-0.031
-22.99%
1 jan 1982 ano
0.265
+0.161
154.77%
1 jan 1983 ano
0.381
+0.116
43.71%
1 jan 1984 ano
0.242
-0.139
-36.45%
1 jan 1985 ano
0.191
-0.051
-20.97%
1 jan 1986 ano
0.146
-0.045
-23.71%
1 jan 1987 ano
0.289
+0.143
98.21%
1 jan 1988 ano
0.408
+0.118
40.96%
1 jan 1989 ano
0.729
+0.321
78.87%
1 jan 1990 ano
0.846
+0.117
16.07%
1 jan 1991 ano
0.764
-0.083
-9.78%
1 jan 1992 ano
0.85
+0.086
11.27%
1 jan 1993 ano
0.413
-0.436
-51.35%
1 jan 1994 ano
0.7
+0.286
69.32%
1 jan 1995 ano
0.624
-0.076
-10.83%
1 jan 1996 ano
0.761
+0.137
21.94%
1 jan 1997 ano
0.647
-0.114
-14.94%
1 jan 1998 ano
0.964
+0.316
48.88%
1 jan 1999 ano
1.128
+0.165
17.08%
1 jan 2000 ano
1.151
+0.023
2.02%
1 jan 2001 ano
1.02
-0.131
-11.42%
1 jan 2002 ano
1.157
+0.137
13.44%
1 jan 2003 ano
1.179
+0.022
1.89%
1 jan 2004 ano
1.156
-0.022
-1.88%
1 jan 2005 ano
1.185
+0.029
2.51%
1 jan 2006 ano
1.457
+0.271
22.9%
1 jan 2007 ano
1.687
+0.23
15.76%
1 jan 2008 ano
1.76
+0.073
4.33%
1 jan 2009 ano
2.388
+0.628
35.7%
1 jan 2010 ano
2.61
+0.223
9.33%
1 jan 2011 ano
1.921
-0.69
-26.42%
1 jan 2012 ano
2.6
+0.679
35.33%
1 jan 2013 ano
2.45
-0.149
-5.74%
1 jan 2014 ano
2.6
+0.15
6.12%
1 jan 2015 ano
2.449
-0.151
-5.82%
Classificação de países por estatísticas atuais por anos


Comentários: