29
/pt/
pt
AIzaSyAYiBZKx7MnpbEhh9jyipgxe19OcubqV5w
April 1, 2024
41666
Latin America & Caribbean
LCN
false
2
1
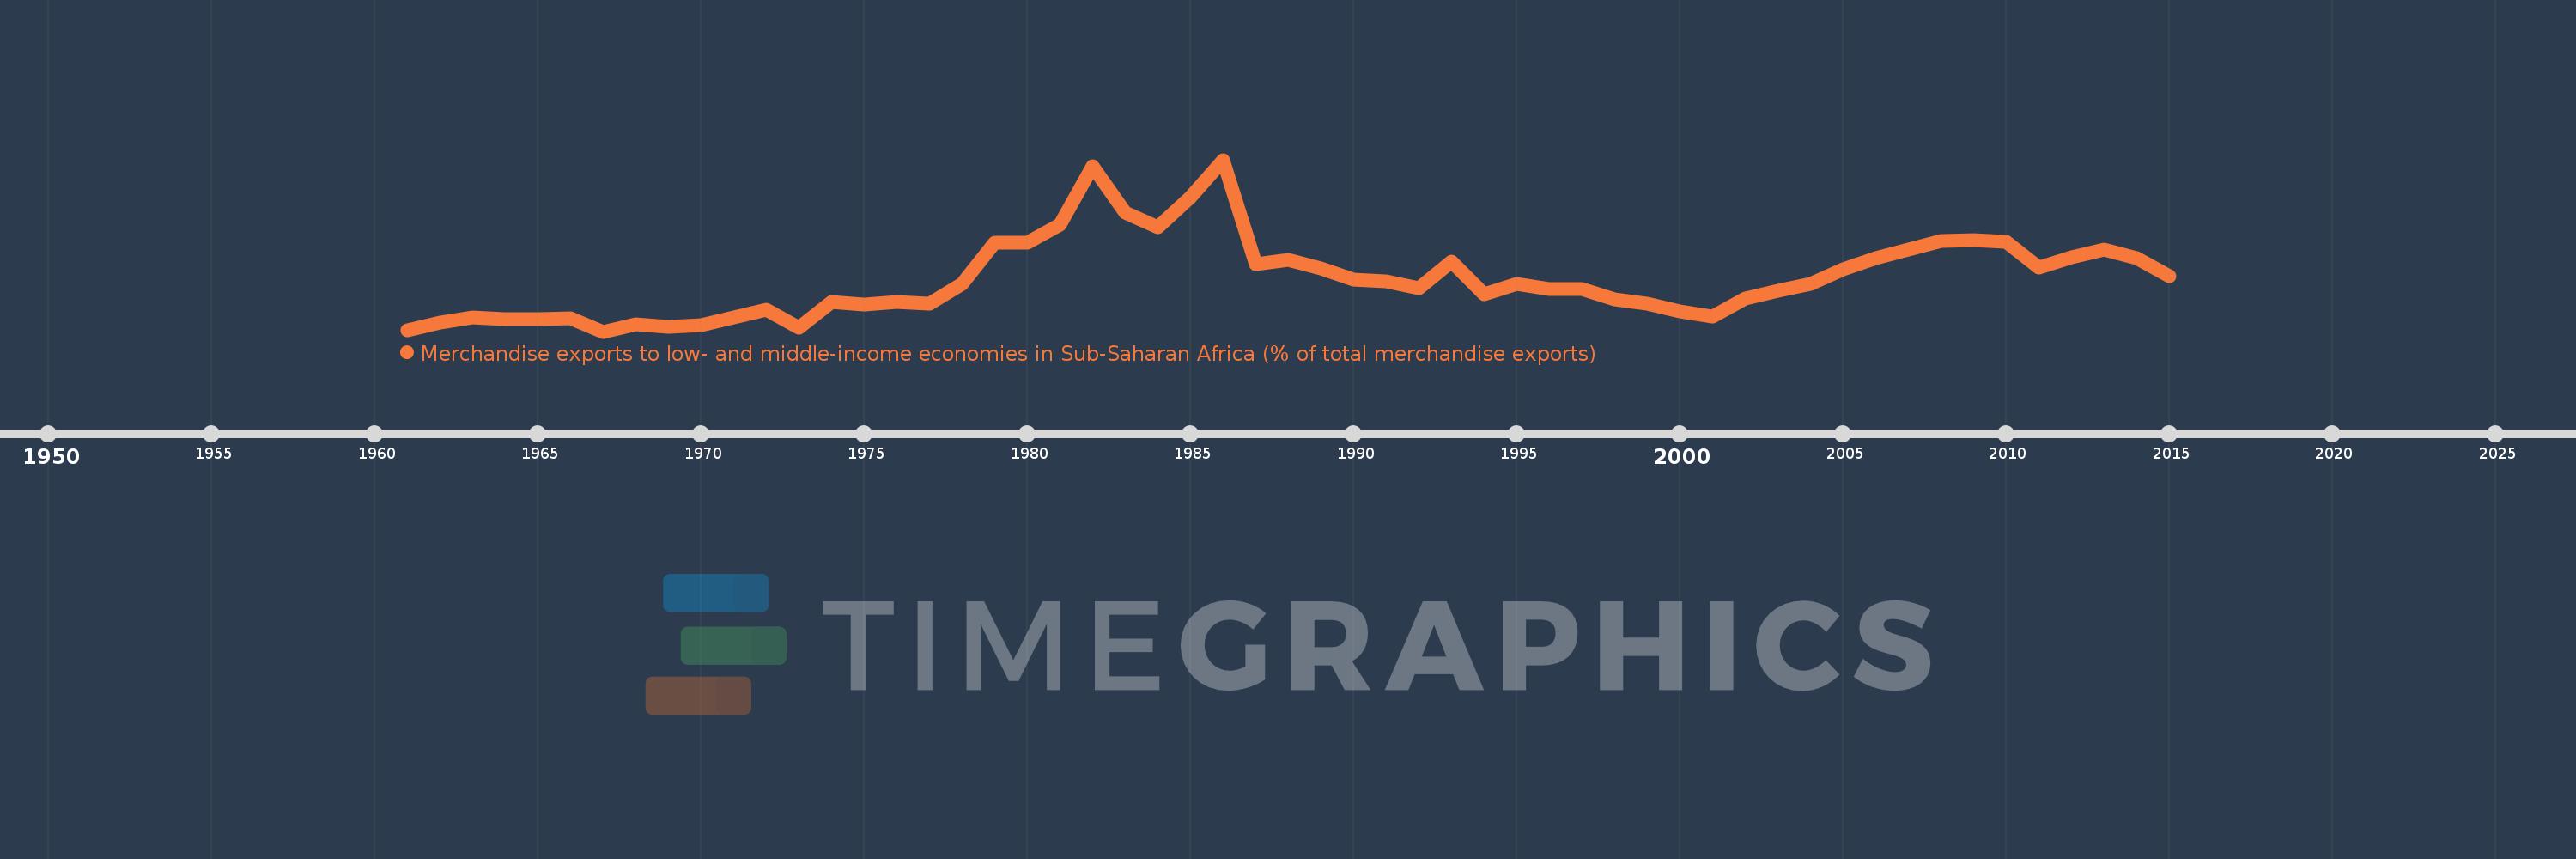
Merchandise exports to low- and middle-income economies in Sub-Saharan Africa (% of total merchandise exports)
2015,2014,2013,2012,2011,2010,2009,2008,2007,2006,2005,2004,2003,2002,2001,2000,1999,1998,1997,1996,1995,1994,1993,1992,1991,1990,1989,1988,1987,1986,1985,1984,1983,1982,1981,1980,1979,1978,1977,1976,1975,1974,1973,1972,1971,1970,1969,1968,1967,1966,1965,1964,1963,1962,1961
Estas estatísticas em outros países:
AfghanistanAlbaniaAlgeriaAngolaArab WorldArgentinaArmeniaAustraliaAustriaAzerbaijanBahamas, TheBahrainBangladeshBarbadosBelarusBelgiumBelizeBeninBermudaBoliviaBrazilBulgariaBurkina FasoBurundiCabo VerdeCambodiaCameroonCanadaCaribbean small statesCentral African RepublicCentral Europe and the BalticsChadChileChinaColombiaCongo, Dem. Rep.Congo, Rep.Costa RicaCote d'IvoireCroatiaCubaCyprusCzech RepublicDenmarkDjiboutiDominicaDominican RepublicEarly-demographic dividendEast Asia & PacificEast Asia & Pacific (excluding high income)East Asia & Pacific (IDA & IBRD countries)EcuadorEgypt, Arab Rep.EstoniaEthiopiaEuro areaEurope & Central AsiaEurope & Central Asia (excluding high income)Europe & Central Asia (IDA & IBRD countries)European UnionFijiFinlandFragile and conflict affected situationsFranceGabonGambia, TheGeorgiaGermanyGhanaGibraltarGreeceGreenlandGuatemalaGuineaGuinea-BissauGuyanaHaitiHeavily indebted poor countries (HIPC)High incomeHondurasHong Kong SAR, ChinaHungaryIBRD onlyIcelandIDA & IBRD totalIDA blendIDA onlyIDA totalIndiaIndonesiaIran, Islamic Rep.IraqIrelandIsraelItalyJamaicaJapanJordanKazakhstanKenyaKorea, Dem. People’s Rep.Korea, Rep.KuwaitLao PDRLate-demographic dividendLatin America & Caribbean Latin America & Caribbean (excluding high income)Latin America & the Caribbean (IDA & IBRD countries)LatviaLeast developed countries: UN classificationLebanonLiberiaLibyaLithuaniaLow & middle incomeLow incomeLower middle incomeLuxembourgMacao SAR, ChinaMacedonia, FYRMadagascarMalawiMalaysiaMaliMaltaMauritaniaMauritiusMexicoMiddle East & North AfricaMiddle East & North Africa (excluding high income)Middle East & North Africa (IDA & IBRD countries)Middle incomeMoldovaMontenegroMoroccoMozambiqueMyanmarNetherlandsNew ZealandNicaraguaNigerNigeriaNorth AmericaNorwayOECD membersOmanOther small statesPacific island small statesPakistanPanamaPapua New GuineaParaguayPeruPhilippinesPolandPortugalPost-demographic dividendPre-demographic dividendQatarRomaniaRussian FederationRwandaSaudi ArabiaSenegalSerbiaSeychellesSierra LeoneSingaporeSlovak RepublicSloveniaSmall statesSomaliaSouth AfricaSouth AsiaSouth Asia (IDA & IBRD)SpainSri LankaSt. LuciaSt. Vincent and the GrenadinesSub-Saharan Africa Sub-Saharan Africa (excluding high income)Sub-Saharan Africa (IDA & IBRD countries)SudanSurinameSwedenSwitzerlandSyrian Arab RepublicTanzaniaThailandTogoTrinidad and TobagoTunisiaTurkeyUgandaUkraineUnited Arab EmiratesUnited KingdomUnited StatesUpper middle incomeUruguayVenezuela, RBVietnamWorldYemen, Rep.ZambiaZimbabwe Linha do tempo:
Nesta escala de tempo está apresentado um gráfico de 1961 ano até 2015 ano Latin America & Caribbean . Dados de 1960 ano ausente. O número de observações reais por data: 55.
Fonte (nome):
Indicadores de desenvolvimento mundial
Fonte (organização):
World Bank staff estimates based data from International Monetary Fund's Direction of Trade database.
Categorias:
Private Sector, Trade
Foi atualizado:
23 abr 2017 ano
Indicadores de alterações dos valores ao longo dos anos
Mínimo:
0.267
1 jan 1967 ano
Máximo:
1.909
1 jan 1986 ano
Na data de observação
Valor
Mudança absoluta
A alteração em relação ao valor anterior
1 jan 1961 ano
0.276
+0.276
0.0%
1 jan 1962 ano
0.353
+0.077
27.79%
1 jan 1963 ano
0.406
+0.054
15.21%
1 jan 1964 ano
0.39
-0.016
-3.93%
1 jan 1965 ano
0.39
+0.0
0.02%
1 jan 1966 ano
0.392
+0.002
0.42%
1 jan 1967 ano
0.267
-0.125
-31.94%
1 jan 1968 ano
0.339
+0.072
26.98%
1 jan 1969 ano
0.316
-0.023
-6.75%
1 jan 1970 ano
0.331
+0.015
4.64%
1 jan 1971 ano
0.399
+0.069
20.75%
1 jan 1972 ano
0.476
+0.077
19.28%
1 jan 1973 ano
0.305
-0.172
-36.04%
1 jan 1974 ano
0.554
+0.25
81.93%
1 jan 1975 ano
0.527
-0.027
-4.91%
1 jan 1976 ano
0.553
+0.026
5.01%
1 jan 1977 ano
0.535
-0.019
-3.37%
1 jan 1978 ano
0.724
+0.19
35.49%
1 jan 1979 ano
1.119
+0.395
54.54%
1 jan 1980 ano
1.119
0.0
-0.01%
1 jan 1981 ano
1.292
+0.173
15.45%
1 jan 1982 ano
1.85
+0.558
43.16%
1 jan 1983 ano
1.402
-0.448
-24.23%
1 jan 1984 ano
1.263
-0.139
-9.9%
1 jan 1985 ano
1.55
+0.287
22.72%
1 jan 1986 ano
1.909
+0.359
23.17%
1 jan 1987 ano
0.91
-0.999
-52.35%
1 jan 1988 ano
0.955
+0.046
5.04%
1 jan 1989 ano
0.872
-0.084
-8.75%
1 jan 1990 ano
0.765
-0.107
-12.31%
1 jan 1991 ano
0.751
-0.013
-1.75%
1 jan 1992 ano
0.681
-0.07
-9.34%
1 jan 1993 ano
0.938
+0.257
37.79%
1 jan 1994 ano
0.624
-0.314
-33.47%
1 jan 1995 ano
0.72
+0.096
15.35%
1 jan 1996 ano
0.672
-0.049
-6.75%
1 jan 1997 ano
0.67
-0.002
-0.23%
1 jan 1998 ano
0.573
-0.097
-14.41%
1 jan 1999 ano
0.535
-0.038
-6.66%
1 jan 2000 ano
0.456
-0.079
-14.83%
1 jan 2001 ano
0.408
-0.047
-10.41%
1 jan 2002 ano
0.585
+0.176
43.17%
1 jan 2003 ano
0.654
+0.069
11.87%
1 jan 2004 ano
0.722
+0.068
10.35%
1 jan 2005 ano
0.863
+0.141
19.52%
1 jan 2006 ano
0.971
+0.108
12.49%
1 jan 2007 ano
1.048
+0.078
8.03%
1 jan 2008 ano
1.136
+0.087
8.35%
1 jan 2009 ano
1.139
+0.003
0.23%
1 jan 2010 ano
1.124
-0.015
-1.31%
1 jan 2011 ano
0.877
-0.247
-21.97%
1 jan 2012 ano
0.976
+0.099
11.26%
1 jan 2013 ano
1.052
+0.076
7.83%
1 jan 2014 ano
0.972
-0.08
-7.63%
1 jan 2015 ano
0.8
-0.171
-17.64%
Classificação de países por estatísticas atuais por anos


Comentários: