29
/pt/
pt
AIzaSyAYiBZKx7MnpbEhh9jyipgxe19OcubqV5w
April 1, 2024
72869
Australia
AUS
true
2
1
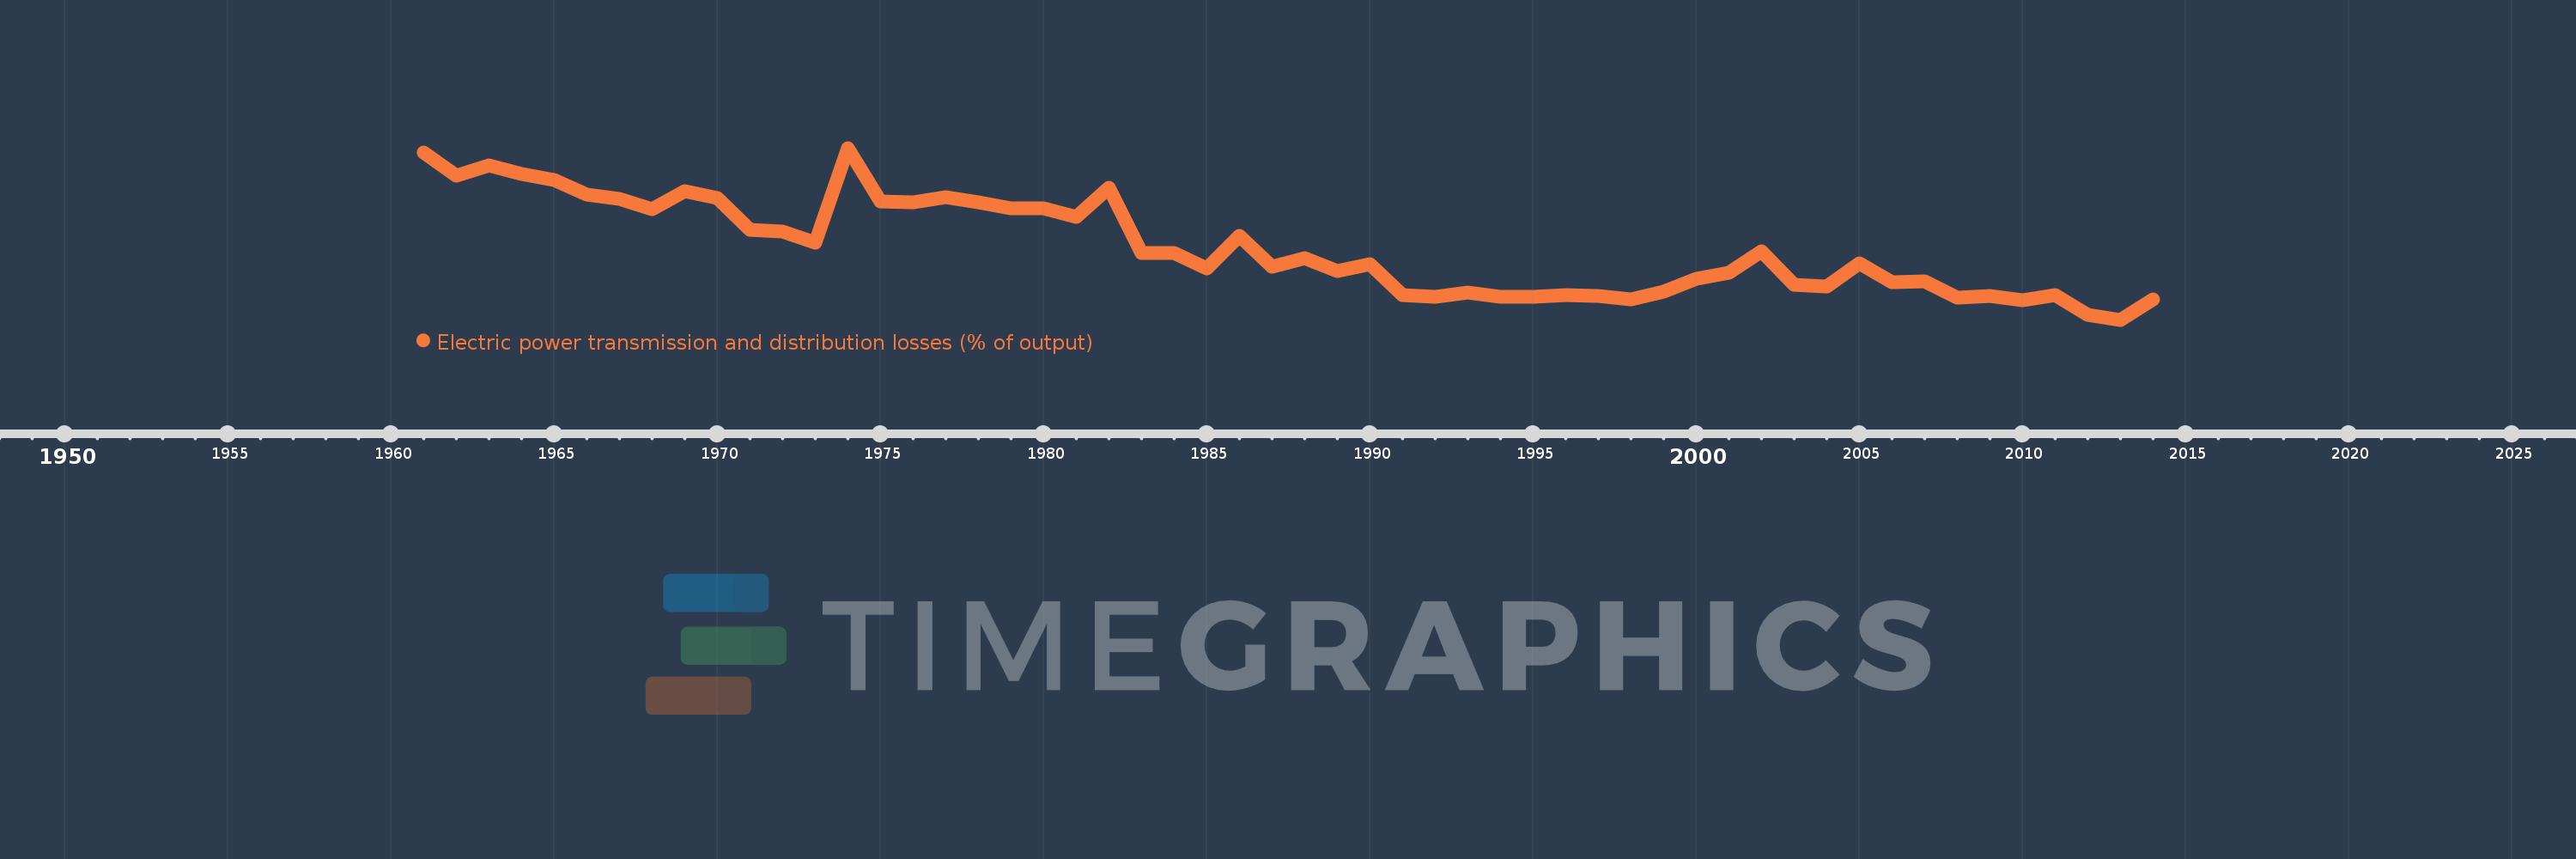
Electric power transmission and distribution losses (% of output)
2014,2013,2012,2011,2010,2009,2008,2007,2006,2005,2004,2003,2002,2001,2000,1999,1998,1997,1996,1995,1994,1993,1992,1991,1990,1989,1988,1987,1986,1985,1984,1983,1982,1981,1980,1979,1978,1977,1976,1975,1974,1973,1972,1971,1970,1969,1968,1967,1966,1965,1964,1963,1962,1961
Estas estatísticas em outros países:
AlbaniaAlgeriaAngolaArab WorldArgentinaArmeniaAustraliaAustriaAzerbaijanBahrainBangladeshBelarusBelgiumBeninBoliviaBosnia and HerzegovinaBotswanaBrazilBrunei DarussalamBulgariaCambodiaCameroonCanadaCaribbean small statesCentral Europe and the BalticsChileChinaColombiaCongo, Dem. Rep.Congo, Rep.Costa RicaCote d'IvoireCroatiaCubaCuracaoCyprusCzech RepublicDenmarkDominican RepublicEarly-demographic dividendEast Asia & PacificEast Asia & Pacific (excluding high income)East Asia & Pacific (IDA & IBRD countries)EcuadorEgypt, Arab Rep.El SalvadorEritreaEstoniaEthiopiaEuro areaEurope & Central AsiaEurope & Central Asia (excluding high income)Europe & Central Asia (IDA & IBRD countries)European UnionFinlandFragile and conflict affected situationsFranceGabonGeorgiaGermanyGhanaGibraltarGreeceGuatemalaHaitiHeavily indebted poor countries (HIPC)High incomeHondurasHong Kong SAR, ChinaHungaryIBRD onlyIcelandIDA & IBRD totalIDA blendIDA onlyIDA totalIndiaIndonesiaIran, Islamic Rep.IraqIrelandIsraelItalyJamaicaJapanJordanKazakhstanKenyaKorea, Dem. People’s Rep.Korea, Rep.KosovoKuwaitKyrgyz RepublicLate-demographic dividendLatin America & Caribbean Latin America & Caribbean (excluding high income)Latin America & the Caribbean (IDA & IBRD countries)LatviaLeast developed countries: UN classificationLebanonLibyaLithuaniaLow & middle incomeLow incomeLower middle incomeLuxembourgMacedonia, FYRMalaysiaMaltaMauritiusMexicoMiddle East & North AfricaMiddle East & North Africa (excluding high income)Middle East & North Africa (IDA & IBRD countries)Middle incomeMoldovaMongoliaMontenegroMoroccoMozambiqueMyanmarNamibiaNepalNetherlandsNew ZealandNicaraguaNigerNigeriaNorth AmericaNorwayOECD membersOmanOther small statesPakistanPanamaParaguayPeruPhilippinesPolandPortugalPost-demographic dividendPre-demographic dividendQatarRomaniaRussian FederationSaudi ArabiaSenegalSerbiaSingaporeSlovak RepublicSloveniaSmall statesSouth AfricaSouth AsiaSouth Asia (IDA & IBRD)South SudanSpainSri LankaSub-Saharan Africa Sub-Saharan Africa (excluding high income)Sub-Saharan Africa (IDA & IBRD countries)SudanSwedenSwitzerlandSyrian Arab RepublicTajikistanTanzaniaThailandTogoTrinidad and TobagoTunisiaTurkeyTurkmenistanUkraineUnited Arab EmiratesUnited KingdomUnited StatesUpper middle incomeUruguayUzbekistanVenezuela, RBVietnamWorldYemen, Rep.ZambiaZimbabwe Linha do tempo:
Nesta escala de tempo está apresentado um gráfico de 1961 ano até 2014 ano Australia. Dados de 1960 ano ausente. O número de observações reais por data: 54.
Fonte (nome):
Indicadores de desenvolvimento mundial
Fonte (organização):
IEA Statistics © OECD/IEA 2014 (http://www.iea.org/stats/index.asp), subject to https://www.iea.org/t&c/termsandconditions/
Categorias:
Energy & Mining, Infrastructure
Foi atualizado:
23 abr 2017 ano
Indicadores de alterações dos valores ao longo dos anos
Mínimo:
5.044
1 jan 2013 ano
Máximo:
12.728
1 jan 1974 ano
Na data de observação
Valor
Mudança absoluta
A alteração em relação ao valor anterior
1 jan 1961 ano
12.532
+12.532
0.0%
1 jan 1962 ano
11.475
-1.057
-8.43%
1 jan 1963 ano
11.931
+0.456
3.97%
1 jan 1964 ano
11.568
-0.363
-3.04%
1 jan 1965 ano
11.283
-0.285
-2.46%
1 jan 1966 ano
10.654
-0.629
-5.57%
1 jan 1967 ano
10.451
-0.203
-1.9%
1 jan 1968 ano
9.984
-0.468
-4.47%
1 jan 1969 ano
10.799
+0.815
8.17%
1 jan 1970 ano
10.472
-0.327
-3.03%
1 jan 1971 ano
9.048
-1.424
-13.6%
1 jan 1972 ano
8.987
-0.061
-0.68%
1 jan 1973 ano
8.486
-0.5
-5.57%
1 jan 1974 ano
12.728
+4.241
49.98%
1 jan 1975 ano
10.317
-2.411
-18.94%
1 jan 1976 ano
10.287
-0.03
-0.29%
1 jan 1977 ano
10.534
+0.247
2.4%
1 jan 1978 ano
10.286
-0.247
-2.35%
1 jan 1979 ano
10.028
-0.259
-2.52%
1 jan 1980 ano
10.008
-0.019
-0.19%
1 jan 1981 ano
9.625
-0.384
-3.83%
1 jan 1982 ano
10.952
+1.327
13.79%
1 jan 1983 ano
8.026
-2.926
-26.72%
1 jan 1984 ano
8.015
-0.011
-0.14%
1 jan 1985 ano
7.327
-0.688
-8.58%
1 jan 1986 ano
8.805
+1.478
20.17%
1 jan 1987 ano
7.42
-1.385
-15.73%
1 jan 1988 ano
7.811
+0.391
5.26%
1 jan 1989 ano
7.23
-0.581
-7.43%
1 jan 1990 ano
7.548
+0.318
4.4%
1 jan 1991 ano
6.158
-1.39
-18.42%
1 jan 1992 ano
6.082
-0.076
-1.23%
1 jan 1993 ano
6.257
+0.175
2.88%
1 jan 1994 ano
6.075
-0.183
-2.92%
1 jan 1995 ano
6.051
-0.023
-0.38%
1 jan 1996 ano
6.142
+0.09
1.49%
1 jan 1997 ano
6.101
-0.04
-0.66%
1 jan 1998 ano
5.967
-0.134
-2.2%
1 jan 1999 ano
6.313
+0.346
5.79%
1 jan 2000 ano
6.893
+0.581
9.2%
1 jan 2001 ano
7.138
+0.244
3.55%
1 jan 2002 ano
8.094
+0.956
13.39%
1 jan 2003 ano
6.624
-1.469
-18.15%
1 jan 2004 ano
6.541
-0.083
-1.25%
1 jan 2005 ano
7.555
+1.014
15.5%
1 jan 2006 ano
6.723
-0.832
-11.01%
1 jan 2007 ano
6.746
+0.023
0.34%
1 jan 2008 ano
6.016
-0.73
-10.81%
1 jan 2009 ano
6.093
+0.077
1.28%
1 jan 2010 ano
5.897
-0.196
-3.21%
1 jan 2011 ano
6.155
+0.257
4.36%
1 jan 2012 ano
5.257
-0.898
-14.59%
1 jan 2013 ano
5.044
-0.213
-4.05%
1 jan 2014 ano
5.941
+0.897
17.79%
Classificação de países por estatísticas atuais por anos


Comentários: