29
/pt/
pt
AIzaSyAYiBZKx7MnpbEhh9jyipgxe19OcubqV5w
April 1, 2024
209214
New Zealand
NZL
true
2
1
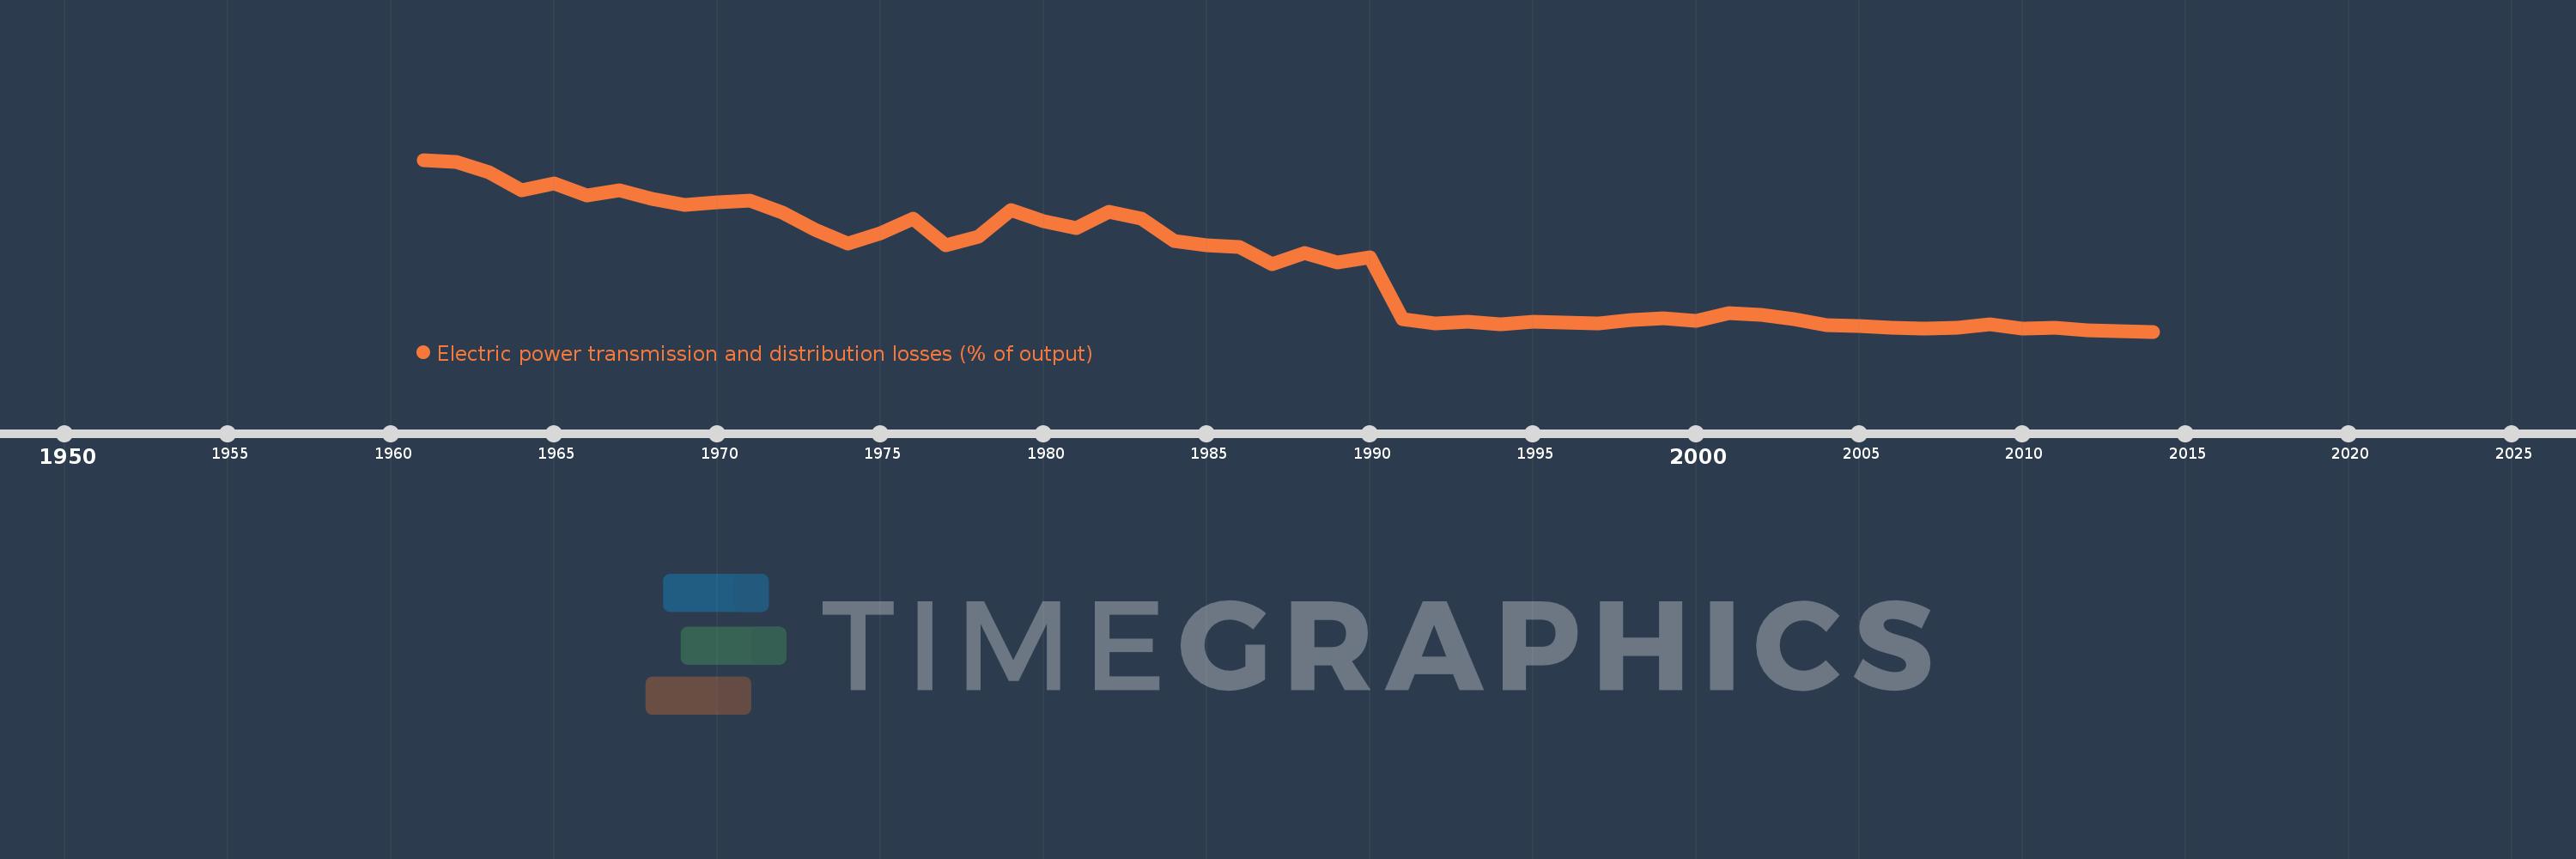
Electric power transmission and distribution losses (% of output)
2014,2013,2012,2011,2010,2009,2008,2007,2006,2005,2004,2003,2002,2001,2000,1999,1998,1997,1996,1995,1994,1993,1992,1991,1990,1989,1988,1987,1986,1985,1984,1983,1982,1981,1980,1979,1978,1977,1976,1975,1974,1973,1972,1971,1970,1969,1968,1967,1966,1965,1964,1963,1962,1961
Estas estatísticas em outros países:
AlbaniaAlgeriaAngolaArab WorldArgentinaArmeniaAustraliaAustriaAzerbaijanBahrainBangladeshBelarusBelgiumBeninBoliviaBosnia and HerzegovinaBotswanaBrazilBrunei DarussalamBulgariaCambodiaCameroonCanadaCaribbean small statesCentral Europe and the BalticsChileChinaColombiaCongo, Dem. Rep.Congo, Rep.Costa RicaCote d'IvoireCroatiaCubaCuracaoCyprusCzech RepublicDenmarkDominican RepublicEarly-demographic dividendEast Asia & PacificEast Asia & Pacific (excluding high income)East Asia & Pacific (IDA & IBRD countries)EcuadorEgypt, Arab Rep.El SalvadorEritreaEstoniaEthiopiaEuro areaEurope & Central AsiaEurope & Central Asia (excluding high income)Europe & Central Asia (IDA & IBRD countries)European UnionFinlandFragile and conflict affected situationsFranceGabonGeorgiaGermanyGhanaGibraltarGreeceGuatemalaHaitiHeavily indebted poor countries (HIPC)High incomeHondurasHong Kong SAR, ChinaHungaryIBRD onlyIcelandIDA & IBRD totalIDA blendIDA onlyIDA totalIndiaIndonesiaIran, Islamic Rep.IraqIrelandIsraelItalyJamaicaJapanJordanKazakhstanKenyaKorea, Dem. People’s Rep.Korea, Rep.KosovoKuwaitKyrgyz RepublicLate-demographic dividendLatin America & Caribbean Latin America & Caribbean (excluding high income)Latin America & the Caribbean (IDA & IBRD countries)LatviaLeast developed countries: UN classificationLebanonLibyaLithuaniaLow & middle incomeLow incomeLower middle incomeLuxembourgMacedonia, FYRMalaysiaMaltaMauritiusMexicoMiddle East & North AfricaMiddle East & North Africa (excluding high income)Middle East & North Africa (IDA & IBRD countries)Middle incomeMoldovaMongoliaMontenegroMoroccoMozambiqueMyanmarNamibiaNepalNetherlandsNew ZealandNicaraguaNigerNigeriaNorth AmericaNorwayOECD membersOmanOther small statesPakistanPanamaParaguayPeruPhilippinesPolandPortugalPost-demographic dividendPre-demographic dividendQatarRomaniaRussian FederationSaudi ArabiaSenegalSerbiaSingaporeSlovak RepublicSloveniaSmall statesSouth AfricaSouth AsiaSouth Asia (IDA & IBRD)South SudanSpainSri LankaSub-Saharan Africa Sub-Saharan Africa (excluding high income)Sub-Saharan Africa (IDA & IBRD countries)SudanSwedenSwitzerlandSyrian Arab RepublicTajikistanTanzaniaThailandTogoTrinidad and TobagoTunisiaTurkeyTurkmenistanUkraineUnited Arab EmiratesUnited KingdomUnited StatesUpper middle incomeUruguayUzbekistanVenezuela, RBVietnamWorldYemen, Rep.ZambiaZimbabwe Linha do tempo:
Nesta escala de tempo está apresentado um gráfico de 1961 ano até 2014 ano New Zealand. Dados de 1960 ano ausente. O número de observações reais por data: 54.
Fonte (nome):
Indicadores de desenvolvimento mundial
Fonte (organização):
IEA Statistics © OECD/IEA 2014 (http://www.iea.org/stats/index.asp), subject to https://www.iea.org/t&c/termsandconditions/
Categorias:
Energy & Mining, Infrastructure
Foi atualizado:
23 abr 2017 ano
Indicadores de alterações dos valores ao longo dos anos
Mínimo:
6.711
1 jan 2014 ano
Máximo:
16.48
1 jan 1961 ano
Na data de observação
Valor
Mudança absoluta
A alteração em relação ao valor anterior
1 jan 1961 ano
16.48
+16.48
0.0%
1 jan 1962 ano
16.376
-0.104
-0.63%
1 jan 1963 ano
15.783
-0.593
-3.62%
1 jan 1964 ano
14.762
-1.021
-6.47%
1 jan 1965 ano
15.145
+0.383
2.6%
1 jan 1966 ano
14.452
-0.693
-4.58%
1 jan 1967 ano
14.73
+0.278
1.92%
1 jan 1968 ano
14.246
-0.484
-3.29%
1 jan 1969 ano
13.931
-0.315
-2.21%
1 jan 1970 ano
14.077
+0.146
1.05%
1 jan 1971 ano
14.139
+0.062
0.44%
1 jan 1972 ano
13.477
-0.661
-4.68%
1 jan 1973 ano
12.508
-0.969
-7.19%
1 jan 1974 ano
11.694
-0.814
-6.51%
1 jan 1975 ano
12.29
+0.596
5.1%
1 jan 1976 ano
13.11
+0.82
6.67%
1 jan 1977 ano
11.642
-1.468
-11.2%
1 jan 1978 ano
12.102
+0.46
3.95%
1 jan 1979 ano
13.62
+1.518
12.55%
1 jan 1980 ano
12.983
-0.637
-4.68%
1 jan 1981 ano
12.608
-0.375
-2.89%
1 jan 1982 ano
13.513
+0.904
7.17%
1 jan 1983 ano
13.136
-0.377
-2.79%
1 jan 1984 ano
11.852
-1.284
-9.77%
1 jan 1985 ano
11.644
-0.208
-1.76%
1 jan 1986 ano
11.506
-0.138
-1.18%
1 jan 1987 ano
10.537
-0.969
-8.43%
1 jan 1988 ano
11.157
+0.62
5.88%
1 jan 1989 ano
10.659
-0.498
-4.46%
1 jan 1990 ano
10.935
+0.276
2.59%
1 jan 1991 ano
7.404
-3.531
-32.29%
1 jan 1992 ano
7.181
-0.223
-3.02%
1 jan 1993 ano
7.272
+0.091
1.26%
1 jan 1994 ano
7.145
-0.127
-1.74%
1 jan 1995 ano
7.265
+0.12
1.68%
1 jan 1996 ano
7.235
-0.03
-0.42%
1 jan 1997 ano
7.164
-0.071
-0.98%
1 jan 1998 ano
7.37
+0.206
2.88%
1 jan 1999 ano
7.444
+0.074
1.01%
1 jan 2000 ano
7.322
-0.122
-1.64%
1 jan 2001 ano
7.759
+0.436
5.96%
1 jan 2002 ano
7.652
-0.107
-1.37%
1 jan 2003 ano
7.416
-0.236
-3.08%
1 jan 2004 ano
7.095
-0.321
-4.33%
1 jan 2005 ano
7.044
-0.051
-0.72%
1 jan 2006 ano
6.931
-0.113
-1.61%
1 jan 2007 ano
6.906
-0.025
-0.36%
1 jan 2008 ano
6.924
+0.018
0.26%
1 jan 2009 ano
7.14
+0.216
3.12%
1 jan 2010 ano
6.886
-0.254
-3.56%
1 jan 2011 ano
6.91
+0.025
0.36%
1 jan 2012 ano
6.767
-0.143
-2.07%
1 jan 2013 ano
6.725
-0.042
-0.63%
1 jan 2014 ano
6.711
-0.013
-0.2%
Classificação de países por estatísticas atuais por anos


Comentários: