29
/pt/
pt
AIzaSyAYiBZKx7MnpbEhh9jyipgxe19OcubqV5w
April 1, 2024
181975
Luxembourg
LUX
true
2
1
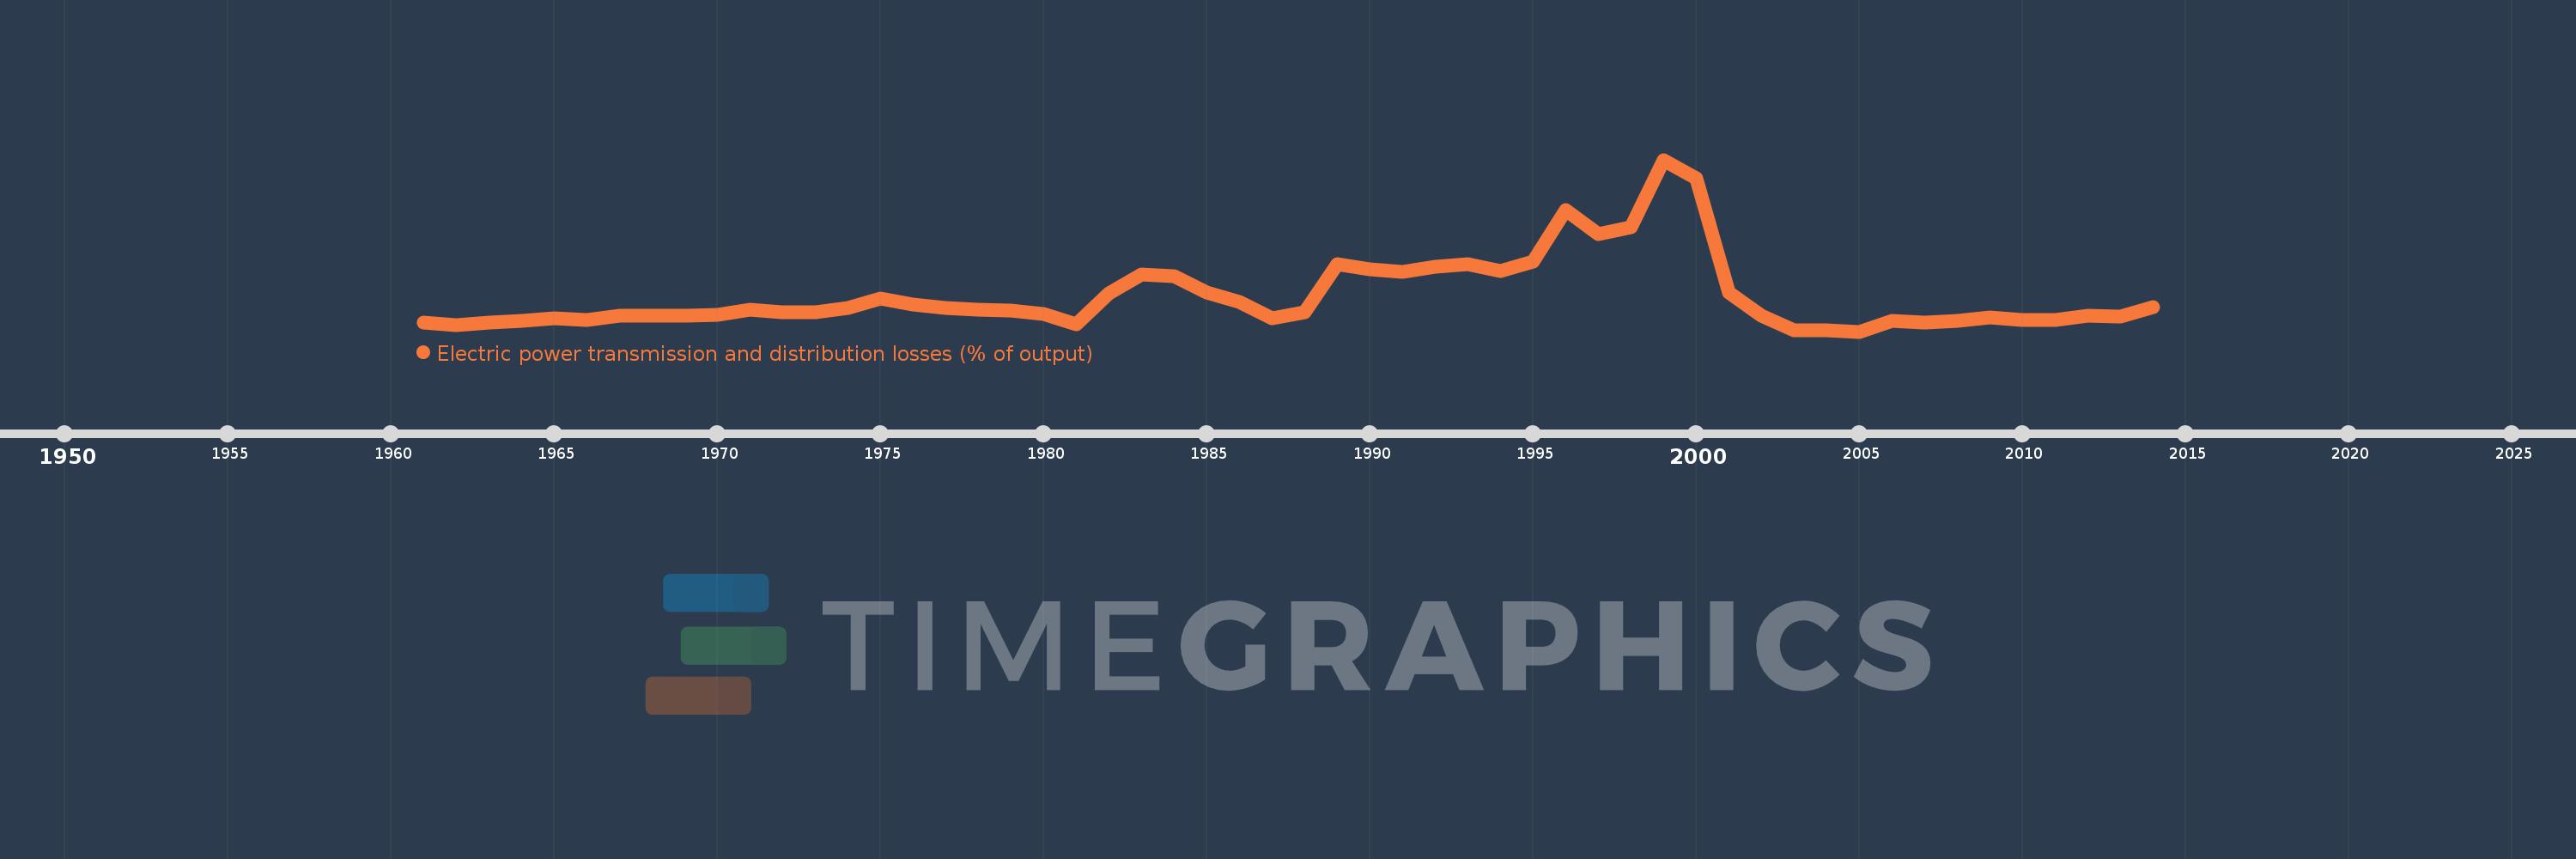
Electric power transmission and distribution losses (% of output)
2014,2013,2012,2011,2010,2009,2008,2007,2006,2005,2004,2003,2002,2001,2000,1999,1998,1997,1996,1995,1994,1993,1992,1991,1990,1989,1988,1987,1986,1985,1984,1983,1982,1981,1980,1979,1978,1977,1976,1975,1974,1973,1972,1971,1970,1969,1968,1967,1966,1965,1964,1963,1962,1961
Estas estatísticas em outros países:
AlbaniaAlgeriaAngolaArab WorldArgentinaArmeniaAustraliaAustriaAzerbaijanBahrainBangladeshBelarusBelgiumBeninBoliviaBosnia and HerzegovinaBotswanaBrazilBrunei DarussalamBulgariaCambodiaCameroonCanadaCaribbean small statesCentral Europe and the BalticsChileChinaColombiaCongo, Dem. Rep.Congo, Rep.Costa RicaCote d'IvoireCroatiaCubaCuracaoCyprusCzech RepublicDenmarkDominican RepublicEarly-demographic dividendEast Asia & PacificEast Asia & Pacific (excluding high income)East Asia & Pacific (IDA & IBRD countries)EcuadorEgypt, Arab Rep.El SalvadorEritreaEstoniaEthiopiaEuro areaEurope & Central AsiaEurope & Central Asia (excluding high income)Europe & Central Asia (IDA & IBRD countries)European UnionFinlandFragile and conflict affected situationsFranceGabonGeorgiaGermanyGhanaGibraltarGreeceGuatemalaHaitiHeavily indebted poor countries (HIPC)High incomeHondurasHong Kong SAR, ChinaHungaryIBRD onlyIcelandIDA & IBRD totalIDA blendIDA onlyIDA totalIndiaIndonesiaIran, Islamic Rep.IraqIrelandIsraelItalyJamaicaJapanJordanKazakhstanKenyaKorea, Dem. People’s Rep.Korea, Rep.KosovoKuwaitKyrgyz RepublicLate-demographic dividendLatin America & Caribbean Latin America & Caribbean (excluding high income)Latin America & the Caribbean (IDA & IBRD countries)LatviaLeast developed countries: UN classificationLebanonLibyaLithuaniaLow & middle incomeLow incomeLower middle incomeLuxembourgMacedonia, FYRMalaysiaMaltaMauritiusMexicoMiddle East & North AfricaMiddle East & North Africa (excluding high income)Middle East & North Africa (IDA & IBRD countries)Middle incomeMoldovaMongoliaMontenegroMoroccoMozambiqueMyanmarNamibiaNepalNetherlandsNew ZealandNicaraguaNigerNigeriaNorth AmericaNorwayOECD membersOmanOther small statesPakistanPanamaParaguayPeruPhilippinesPolandPortugalPost-demographic dividendPre-demographic dividendQatarRomaniaRussian FederationSaudi ArabiaSenegalSerbiaSingaporeSlovak RepublicSloveniaSmall statesSouth AfricaSouth AsiaSouth Asia (IDA & IBRD)South SudanSpainSri LankaSub-Saharan Africa Sub-Saharan Africa (excluding high income)Sub-Saharan Africa (IDA & IBRD countries)SudanSwedenSwitzerlandSyrian Arab RepublicTajikistanTanzaniaThailandTogoTrinidad and TobagoTunisiaTurkeyTurkmenistanUkraineUnited Arab EmiratesUnited KingdomUnited StatesUpper middle incomeUruguayUzbekistanVenezuela, RBVietnamWorldYemen, Rep.ZambiaZimbabwe Linha do tempo:
Nesta escala de tempo está apresentado um gráfico de 1961 ano até 2014 ano Luxembourg. Dados de 1960 ano ausente. O número de observações reais por data: 54.
Fonte (nome):
Indicadores de desenvolvimento mundial
Fonte (organização):
IEA Statistics © OECD/IEA 2014 (http://www.iea.org/stats/index.asp), subject to https://www.iea.org/t&c/termsandconditions/
Categorias:
Energy & Mining, Infrastructure
Foi atualizado:
23 abr 2017 ano
Indicadores de alterações dos valores ao longo dos anos
Mínimo:
1.153
1 jan 2005 ano
Máximo:
39.071
1 jan 1999 ano
Na data de observação
Valor
Mudança absoluta
A alteração em relação ao valor anterior
1 jan 1961 ano
3.074
+3.074
0.0%
1 jan 1962 ano
2.487
-0.587
-19.09%
1 jan 1963 ano
3.082
+0.595
23.94%
1 jan 1964 ano
3.616
+0.534
17.33%
1 jan 1965 ano
4.038
+0.421
11.65%
1 jan 1966 ano
3.761
-0.277
-6.85%
1 jan 1967 ano
4.718
+0.957
25.44%
1 jan 1968 ano
4.694
-0.023
-0.5%
1 jan 1969 ano
4.708
+0.014
0.3%
1 jan 1970 ano
4.931
+0.222
4.72%
1 jan 1971 ano
5.969
+1.038
21.06%
1 jan 1972 ano
5.476
-0.493
-8.25%
1 jan 1973 ano
5.409
-0.067
-1.22%
1 jan 1974 ano
6.313
+0.903
16.7%
1 jan 1975 ano
8.454
+2.141
33.92%
1 jan 1976 ano
7.116
-1.338
-15.83%
1 jan 1977 ano
6.296
-0.82
-11.53%
1 jan 1978 ano
6.074
-0.222
-3.52%
1 jan 1979 ano
5.882
-0.192
-3.15%
1 jan 1980 ano
5.1
-0.782
-13.3%
1 jan 1981 ano
2.723
-2.377
-46.6%
1 jan 1982 ano
9.615
+6.892
253.08%
1 jan 1983 ano
13.838
+4.222
43.91%
1 jan 1984 ano
13.404
-0.433
-3.13%
1 jan 1985 ano
9.851
-3.553
-26.51%
1 jan 1986 ano
7.707
-2.144
-21.77%
1 jan 1987 ano
4.082
-3.625
-47.04%
1 jan 1988 ano
5.363
+1.282
31.4%
1 jan 1989 ano
16.071
+10.708
199.65%
1 jan 1990 ano
14.873
-1.198
-7.45%
1 jan 1991 ano
14.423
-0.45
-3.03%
1 jan 1992 ano
15.549
+1.126
7.81%
1 jan 1993 ano
16.061
+0.511
3.29%
1 jan 1994 ano
14.456
-1.605
-9.99%
1 jan 1995 ano
16.638
+2.182
15.09%
1 jan 1996 ano
27.926
+11.288
67.85%
1 jan 1997 ano
22.727
-5.199
-18.62%
1 jan 1998 ano
24.138
+1.411
6.21%
1 jan 1999 ano
39.071
+14.933
61.87%
1 jan 2000 ano
35.0
-4.071
-10.42%
1 jan 2001 ano
9.716
-25.284
-72.24%
1 jan 2002 ano
4.729
-4.987
-51.33%
1 jan 2003 ano
1.46
-3.269
-69.12%
1 jan 2004 ano
1.47
+0.01
0.68%
1 jan 2005 ano
1.153
-0.317
-21.56%
1 jan 2006 ano
3.465
+2.312
200.46%
1 jan 2007 ano
3.23
-0.234
-6.76%
1 jan 2008 ano
3.561
+0.331
10.25%
1 jan 2009 ano
4.292
+0.731
20.51%
1 jan 2010 ano
3.68
-0.612
-14.25%
1 jan 2011 ano
3.777
+0.097
2.63%
1 jan 2012 ano
4.566
+0.789
20.89%
1 jan 2013 ano
4.389
-0.177
-3.88%
1 jan 2014 ano
6.544
+2.155
49.11%
Classificação de países por estatísticas atuais por anos


Comentários: