29
/pt/
pt
AIzaSyAYiBZKx7MnpbEhh9jyipgxe19OcubqV5w
April 1, 2024
66468
Algeria
DZA
true
2
1
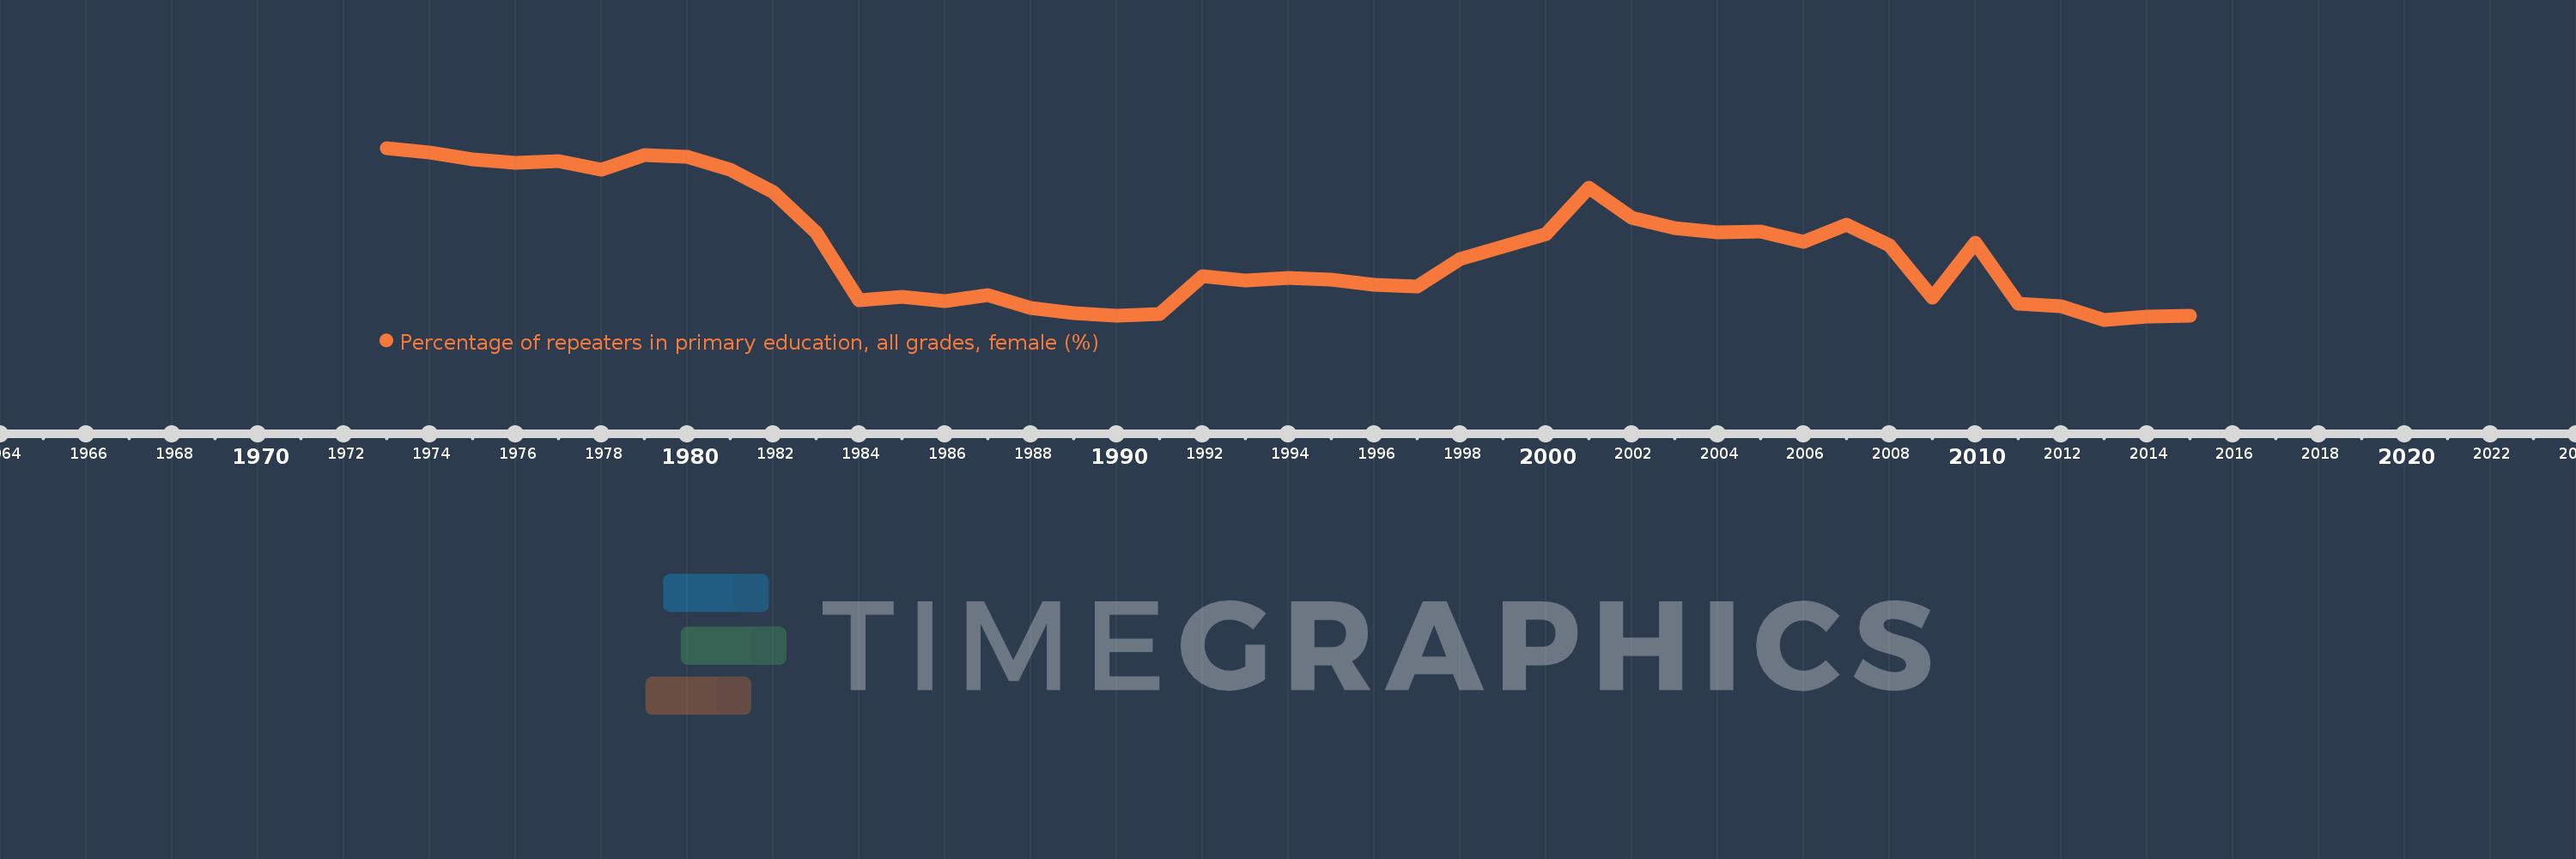
Percentage of repeaters in primary education, all grades, female (%)
2015,2014,2013,2012,2011,2010,2009,2008,2007,2006,2005,2004,2003,2002,2001,2000,1998,1997,1996,1995,1994,1993,1992,1991,1990,1989,1988,1987,1986,1985,1984,1983,1982,1981,1980,1979,1978,1977,1976,1975,1974,1973
Estas estatísticas em outros países:
AfghanistanAlbaniaAlgeriaAndorraAngolaAntigua and BarbudaArab WorldArgentinaArmeniaArubaAustriaAzerbaijanBahamas, TheBahrainBangladeshBelarusBelgiumBelizeBeninBermudaBhutanBoliviaBosnia and HerzegovinaBotswanaBrazilBritish Virgin IslandsBrunei DarussalamBulgariaBurkina FasoBurundiCabo VerdeCambodiaCameroonCanadaCaribbean small statesCayman IslandsCentral African RepublicCentral Europe and the BalticsChadChileChinaColombiaComorosCongo, Dem. Rep.Congo, Rep.Costa RicaCote d'IvoireCroatiaCubaCyprusCzech RepublicDenmarkDjiboutiDominicaDominican RepublicEarly-demographic dividendEast Asia & PacificEast Asia & Pacific (excluding high income)East Asia & Pacific (IDA & IBRD countries)EcuadorEgypt, Arab Rep.El SalvadorEquatorial GuineaEritreaEstoniaEthiopiaEuro areaEurope & Central AsiaEurope & Central Asia (excluding high income)Europe & Central Asia (IDA & IBRD countries)European UnionFijiFinlandFragile and conflict affected situationsFranceGabonGambia, TheGeorgiaGermanyGhanaGreeceGrenadaGuatemalaGuineaGuinea-BissauGuyanaHaitiHeavily indebted poor countries (HIPC)High incomeHondurasHong Kong SAR, ChinaHungaryIBRD onlyIcelandIDA & IBRD totalIDA blendIDA onlyIDA totalIndiaIndonesiaIran, Islamic Rep.IraqIrelandIsraelItalyJamaicaJapanJordanKazakhstanKenyaKiribatiKorea, Rep.KuwaitKyrgyz RepublicLao PDRLate-demographic dividendLatin America & Caribbean Latin America & Caribbean (excluding high income)Latin America & the Caribbean (IDA & IBRD countries)LatviaLeast developed countries: UN classificationLebanonLesothoLiberiaLibyaLiechtensteinLithuaniaLow & middle incomeLow incomeLower middle incomeLuxembourgMacao SAR, ChinaMacedonia, FYRMadagascarMalawiMalaysiaMaldivesMaliMaltaMauritaniaMauritiusMexicoMiddle East & North AfricaMiddle East & North Africa (excluding high income)Middle East & North Africa (IDA & IBRD countries)Middle incomeMoldovaMonacoMongoliaMontenegroMoroccoMozambiqueMyanmarNamibiaNauruNepalNetherlandsNew ZealandNicaraguaNigerNorwayOECD membersOmanOther small statesPacific island small statesPakistanPalauPanamaPapua New GuineaParaguayPeruPhilippinesPolandPortugalPost-demographic dividendPre-demographic dividendQatarRomaniaRussian FederationRwandaSamoaSan MarinoSao Tome and PrincipeSaudi ArabiaSenegalSerbiaSeychellesSierra LeoneSingaporeSint Maarten (Dutch part)Slovak RepublicSloveniaSmall statesSolomon IslandsSomaliaSouth AfricaSouth AsiaSouth Asia (IDA & IBRD)South SudanSpainSri LankaSt. Kitts and NevisSt. LuciaSt. Vincent and the GrenadinesSub-Saharan Africa Sub-Saharan Africa (excluding high income)Sub-Saharan Africa (IDA & IBRD countries)SudanSurinameSwazilandSwedenSwitzerlandSyrian Arab RepublicTajikistanTanzaniaThailandTimor-LesteTogoTongaTrinidad and TobagoTunisiaTurkeyTurks and Caicos IslandsTuvaluUgandaUkraineUnited Arab EmiratesUnited KingdomUpper middle incomeUruguayUzbekistanVanuatuVenezuela, RBVietnamWest Bank and GazaWorldYemen, Rep.ZambiaZimbabwe Linha do tempo:
Nesta escala de tempo está apresentado um gráfico de 1973 ano até 2015 ano Algeria. Dados de 1972 ano ausente. O número de observações reais por data: 42.
Fonte (nome):
Indicadores de desenvolvimento mundial
Fonte (organização):
UNESCO Institute for Statistics
Categorias:
Education, Gender
Foi atualizado:
23 abr 2017 ano
Indicadores de alterações dos valores ao longo dos anos
Mínimo:
4.871
1 jan 2013 ano
Máximo:
12.658
1 jan 1973 ano
Na data de observação
Valor
Mudança absoluta
A alteração em relação ao valor anterior
1 jan 1973 ano
12.658
+12.658
0.0%
1 jan 1974 ano
12.448
-0.21
-1.66%
1 jan 1975 ano
12.13
-0.319
-2.56%
1 jan 1976 ano
11.994
-0.136
-1.12%
1 jan 1977 ano
12.048
+0.054
0.45%
1 jan 1978 ano
11.682
-0.366
-3.04%
1 jan 1979 ano
12.329
+0.648
5.54%
1 jan 1980 ano
12.274
-0.055
-0.45%
1 jan 1981 ano
11.657
-0.617
-5.03%
1 jan 1982 ano
10.664
-0.992
-8.51%
1 jan 1983 ano
8.837
-1.827
-17.13%
1 jan 1984 ano
5.741
-3.096
-35.03%
1 jan 1985 ano
5.915
+0.174
3.03%
1 jan 1986 ano
5.733
-0.183
-3.09%
1 jan 1987 ano
5.983
+0.25
4.37%
1 jan 1988 ano
5.39
-0.593
-9.91%
1 jan 1989 ano
5.161
-0.229
-4.25%
1 jan 1990 ano
5.046
-0.115
-2.22%
1 jan 1991 ano
5.116
+0.07
1.38%
1 jan 1992 ano
6.857
+1.741
34.04%
1 jan 1993 ano
6.644
-0.213
-3.11%
1 jan 1994 ano
6.777
+0.133
2.0%
1 jan 1995 ano
6.685
-0.092
-1.36%
1 jan 1996 ano
6.446
-0.239
-3.57%
1 jan 1997 ano
6.387
-0.059
-0.92%
1 jan 1998 ano
7.63
+1.243
19.47%
1 jan 2000 ano
8.75
+1.12
14.68%
1 jan 2001 ano
10.842
+2.092
23.91%
1 jan 2002 ano
9.511
-1.331
-12.27%
1 jan 2003 ano
9.007
-0.504
-5.3%
1 jan 2004 ano
8.845
-0.162
-1.8%
1 jan 2005 ano
8.864
+0.02
0.22%
1 jan 2006 ano
8.414
-0.45
-5.08%
1 jan 2007 ano
9.191
+0.777
9.23%
1 jan 2008 ano
8.231
-0.96
-10.45%
1 jan 2009 ano
5.865
-2.366
-28.74%
1 jan 2010 ano
8.351
+2.486
42.39%
1 jan 2011 ano
5.595
-2.756
-33.01%
1 jan 2012 ano
5.49
-0.105
-1.88%
1 jan 2013 ano
4.871
-0.619
-11.27%
1 jan 2014 ano
5.022
+0.151
3.09%
1 jan 2015 ano
5.038
+0.017
0.33%
Classificação de países por estatísticas atuais por anos


Comentários: