29
/pt/
pt
AIzaSyAYiBZKx7MnpbEhh9jyipgxe19OcubqV5w
April 1, 2024
165307
Jordan
JOR
true
2
1
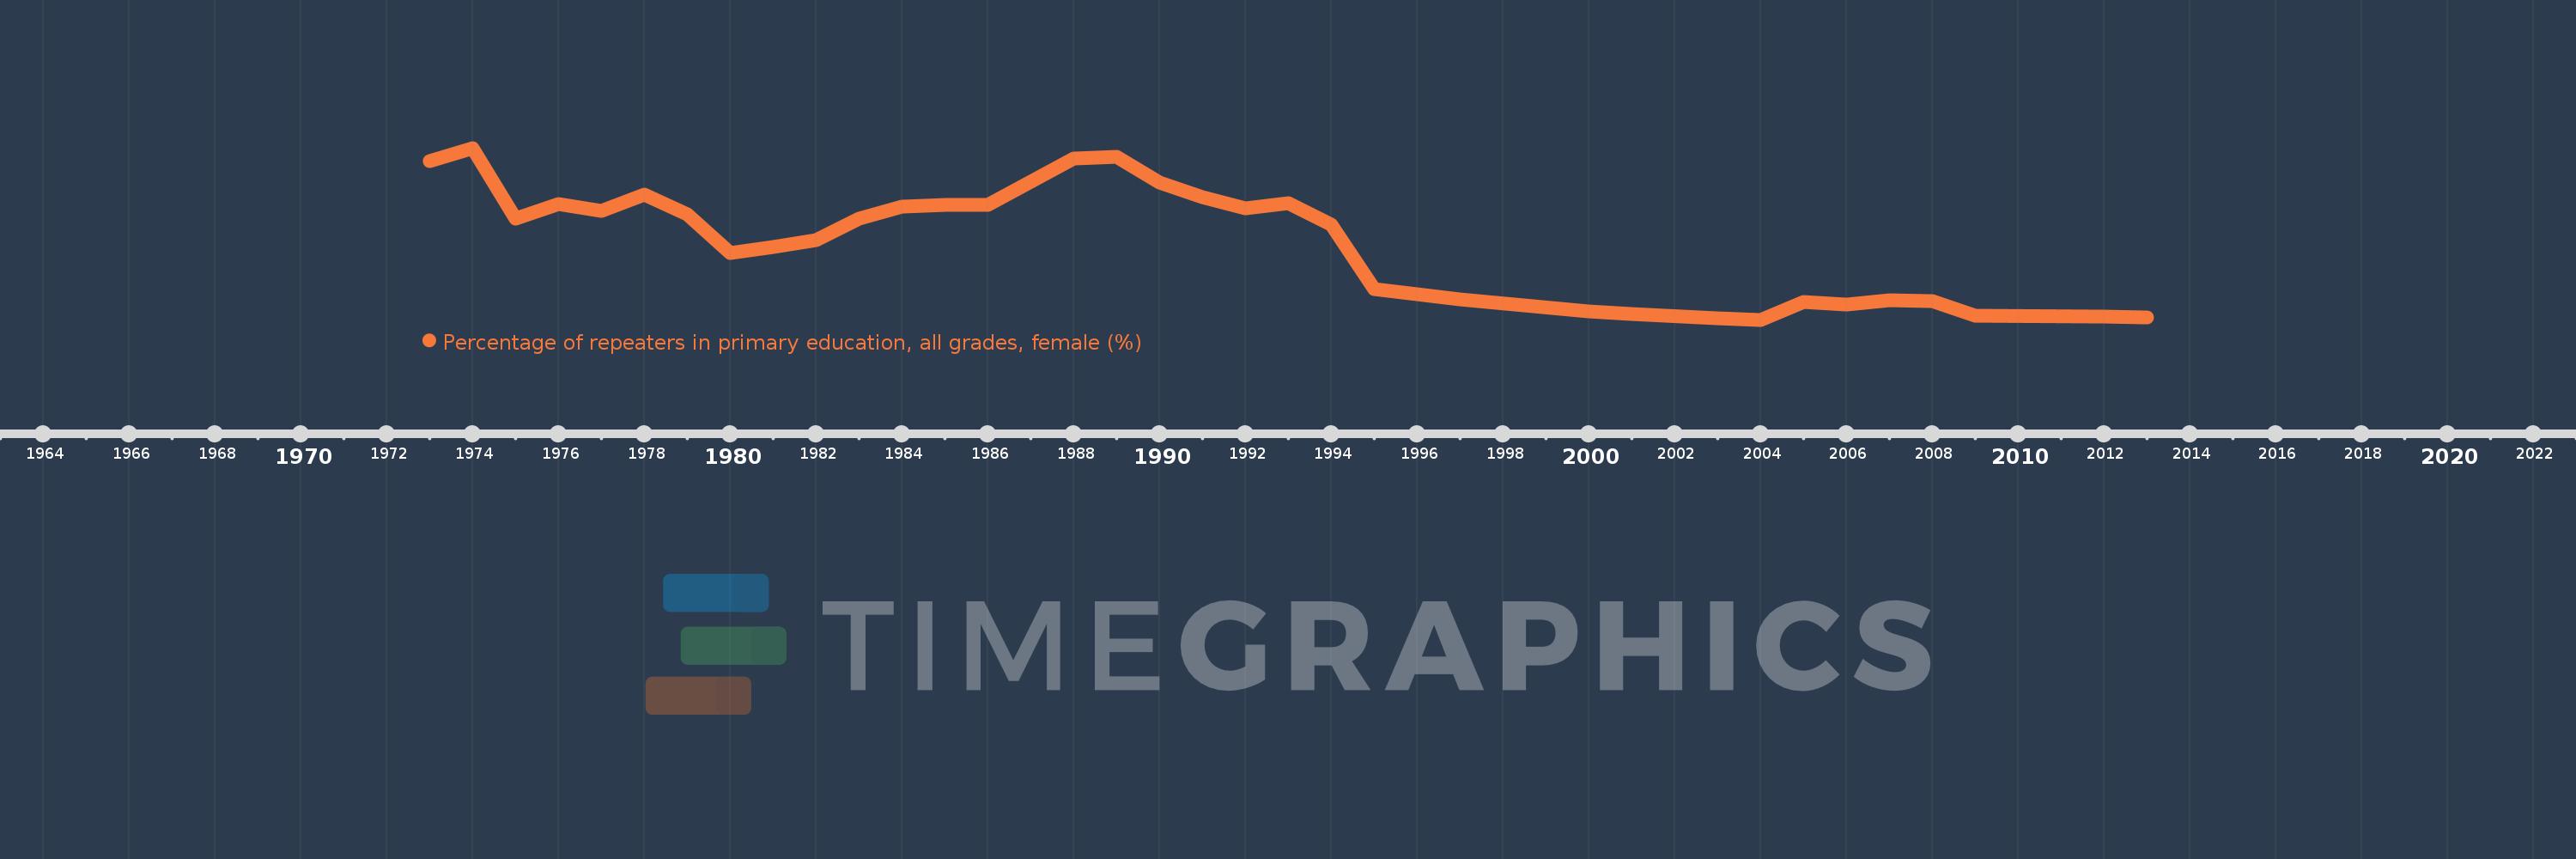
Percentage of repeaters in primary education, all grades, female (%)
2013,2012,2009,2008,2007,2006,2005,2004,2003,2001,2000,1997,1995,1994,1993,1992,1991,1990,1989,1988,1986,1985,1984,1983,1982,1981,1980,1979,1978,1977,1976,1975,1974,1973
Estas estatísticas em outros países:
AfghanistanAlbaniaAlgeriaAndorraAngolaAntigua and BarbudaArab WorldArgentinaArmeniaArubaAustriaAzerbaijanBahamas, TheBahrainBangladeshBelarusBelgiumBelizeBeninBermudaBhutanBoliviaBosnia and HerzegovinaBotswanaBrazilBritish Virgin IslandsBrunei DarussalamBulgariaBurkina FasoBurundiCabo VerdeCambodiaCameroonCanadaCaribbean small statesCayman IslandsCentral African RepublicCentral Europe and the BalticsChadChileChinaColombiaComorosCongo, Dem. Rep.Congo, Rep.Costa RicaCote d'IvoireCroatiaCubaCyprusCzech RepublicDenmarkDjiboutiDominicaDominican RepublicEarly-demographic dividendEast Asia & PacificEast Asia & Pacific (excluding high income)East Asia & Pacific (IDA & IBRD countries)EcuadorEgypt, Arab Rep.El SalvadorEquatorial GuineaEritreaEstoniaEthiopiaEuro areaEurope & Central AsiaEurope & Central Asia (excluding high income)Europe & Central Asia (IDA & IBRD countries)European UnionFijiFinlandFragile and conflict affected situationsFranceGabonGambia, TheGeorgiaGermanyGhanaGreeceGrenadaGuatemalaGuineaGuinea-BissauGuyanaHaitiHeavily indebted poor countries (HIPC)High incomeHondurasHong Kong SAR, ChinaHungaryIBRD onlyIcelandIDA & IBRD totalIDA blendIDA onlyIDA totalIndiaIndonesiaIran, Islamic Rep.IraqIrelandIsraelItalyJamaicaJapanJordanKazakhstanKenyaKiribatiKorea, Rep.KuwaitKyrgyz RepublicLao PDRLate-demographic dividendLatin America & Caribbean Latin America & Caribbean (excluding high income)Latin America & the Caribbean (IDA & IBRD countries)LatviaLeast developed countries: UN classificationLebanonLesothoLiberiaLibyaLiechtensteinLithuaniaLow & middle incomeLow incomeLower middle incomeLuxembourgMacao SAR, ChinaMacedonia, FYRMadagascarMalawiMalaysiaMaldivesMaliMaltaMauritaniaMauritiusMexicoMiddle East & North AfricaMiddle East & North Africa (excluding high income)Middle East & North Africa (IDA & IBRD countries)Middle incomeMoldovaMonacoMongoliaMontenegroMoroccoMozambiqueMyanmarNamibiaNauruNepalNetherlandsNew ZealandNicaraguaNigerNorwayOECD membersOmanOther small statesPacific island small statesPakistanPalauPanamaPapua New GuineaParaguayPeruPhilippinesPolandPortugalPost-demographic dividendPre-demographic dividendQatarRomaniaRussian FederationRwandaSamoaSan MarinoSao Tome and PrincipeSaudi ArabiaSenegalSerbiaSeychellesSierra LeoneSingaporeSint Maarten (Dutch part)Slovak RepublicSloveniaSmall statesSolomon IslandsSomaliaSouth AfricaSouth AsiaSouth Asia (IDA & IBRD)South SudanSpainSri LankaSt. Kitts and NevisSt. LuciaSt. Vincent and the GrenadinesSub-Saharan Africa Sub-Saharan Africa (excluding high income)Sub-Saharan Africa (IDA & IBRD countries)SudanSurinameSwazilandSwedenSwitzerlandSyrian Arab RepublicTajikistanTanzaniaThailandTimor-LesteTogoTongaTrinidad and TobagoTunisiaTurkeyTurks and Caicos IslandsTuvaluUgandaUkraineUnited Arab EmiratesUnited KingdomUpper middle incomeUruguayUzbekistanVanuatuVenezuela, RBVietnamWest Bank and GazaWorldYemen, Rep.ZambiaZimbabwe Linha do tempo:
Nesta escala de tempo está apresentado um gráfico de 1973 ano até 2013 ano Jordan. Dados de 1972 ano ausente. O número de observações reais por data: 34.
Fonte (nome):
Indicadores de desenvolvimento mundial
Fonte (organização):
UNESCO Institute for Statistics
Categorias:
Education, Gender
Foi atualizado:
23 abr 2017 ano
Indicadores de alterações dos valores ao longo dos anos
Mínimo:
0.445
1 jan 2004 ano
Máximo:
6.53
1 jan 1974 ano
Na data de observação
Valor
Mudança absoluta
A alteração em relação ao valor anterior
1 jan 1973 ano
6.074
+6.074
0.0%
1 jan 1974 ano
6.53
+0.457
7.52%
1 jan 1975 ano
4.012
-2.519
-38.57%
1 jan 1976 ano
4.557
+0.545
13.58%
1 jan 1977 ano
4.299
-0.257
-5.64%
1 jan 1978 ano
4.881
+0.582
13.53%
1 jan 1979 ano
4.177
-0.704
-14.43%
1 jan 1980 ano
2.798
-1.379
-33.02%
1 jan 1981 ano
3.036
+0.238
8.51%
1 jan 1982 ano
3.257
+0.221
7.28%
1 jan 1983 ano
4.013
+0.756
23.23%
1 jan 1984 ano
4.466
+0.453
11.3%
1 jan 1985 ano
4.519
+0.052
1.17%
1 jan 1986 ano
4.518
-0.001
-0.03%
1 jan 1988 ano
6.156
+1.639
36.27%
1 jan 1989 ano
6.223
+0.066
1.07%
1 jan 1990 ano
5.317
-0.905
-14.54%
1 jan 1991 ano
4.795
-0.523
-9.83%
1 jan 1992 ano
4.38
-0.414
-8.64%
1 jan 1993 ano
4.579
+0.199
4.54%
1 jan 1994 ano
3.815
-0.764
-16.68%
1 jan 1995 ano
1.518
-2.297
-60.22%
1 jan 1997 ano
1.169
-0.349
-22.97%
1 jan 2000 ano
0.736
-0.433
-37.04%
1 jan 2001 ano
0.642
-0.095
-12.86%
1 jan 2003 ano
0.505
-0.137
-21.33%
1 jan 2004 ano
0.445
-0.059
-11.76%
1 jan 2005 ano
1.062
+0.617
138.56%
1 jan 2006 ano
0.986
-0.076
-7.15%
1 jan 2007 ano
1.138
+0.152
15.4%
1 jan 2008 ano
1.094
-0.044
-3.9%
1 jan 2009 ano
0.6
-0.494
-45.13%
1 jan 2012 ano
0.556
-0.044
-7.32%
1 jan 2013 ano
0.541
-0.015
-2.77%
Classificação de países por estatísticas atuais por anos


Comentários: