29
/pt/
pt
AIzaSyAYiBZKx7MnpbEhh9jyipgxe19OcubqV5w
April 1, 2024
152942
Hungary
HUN
true
2
1
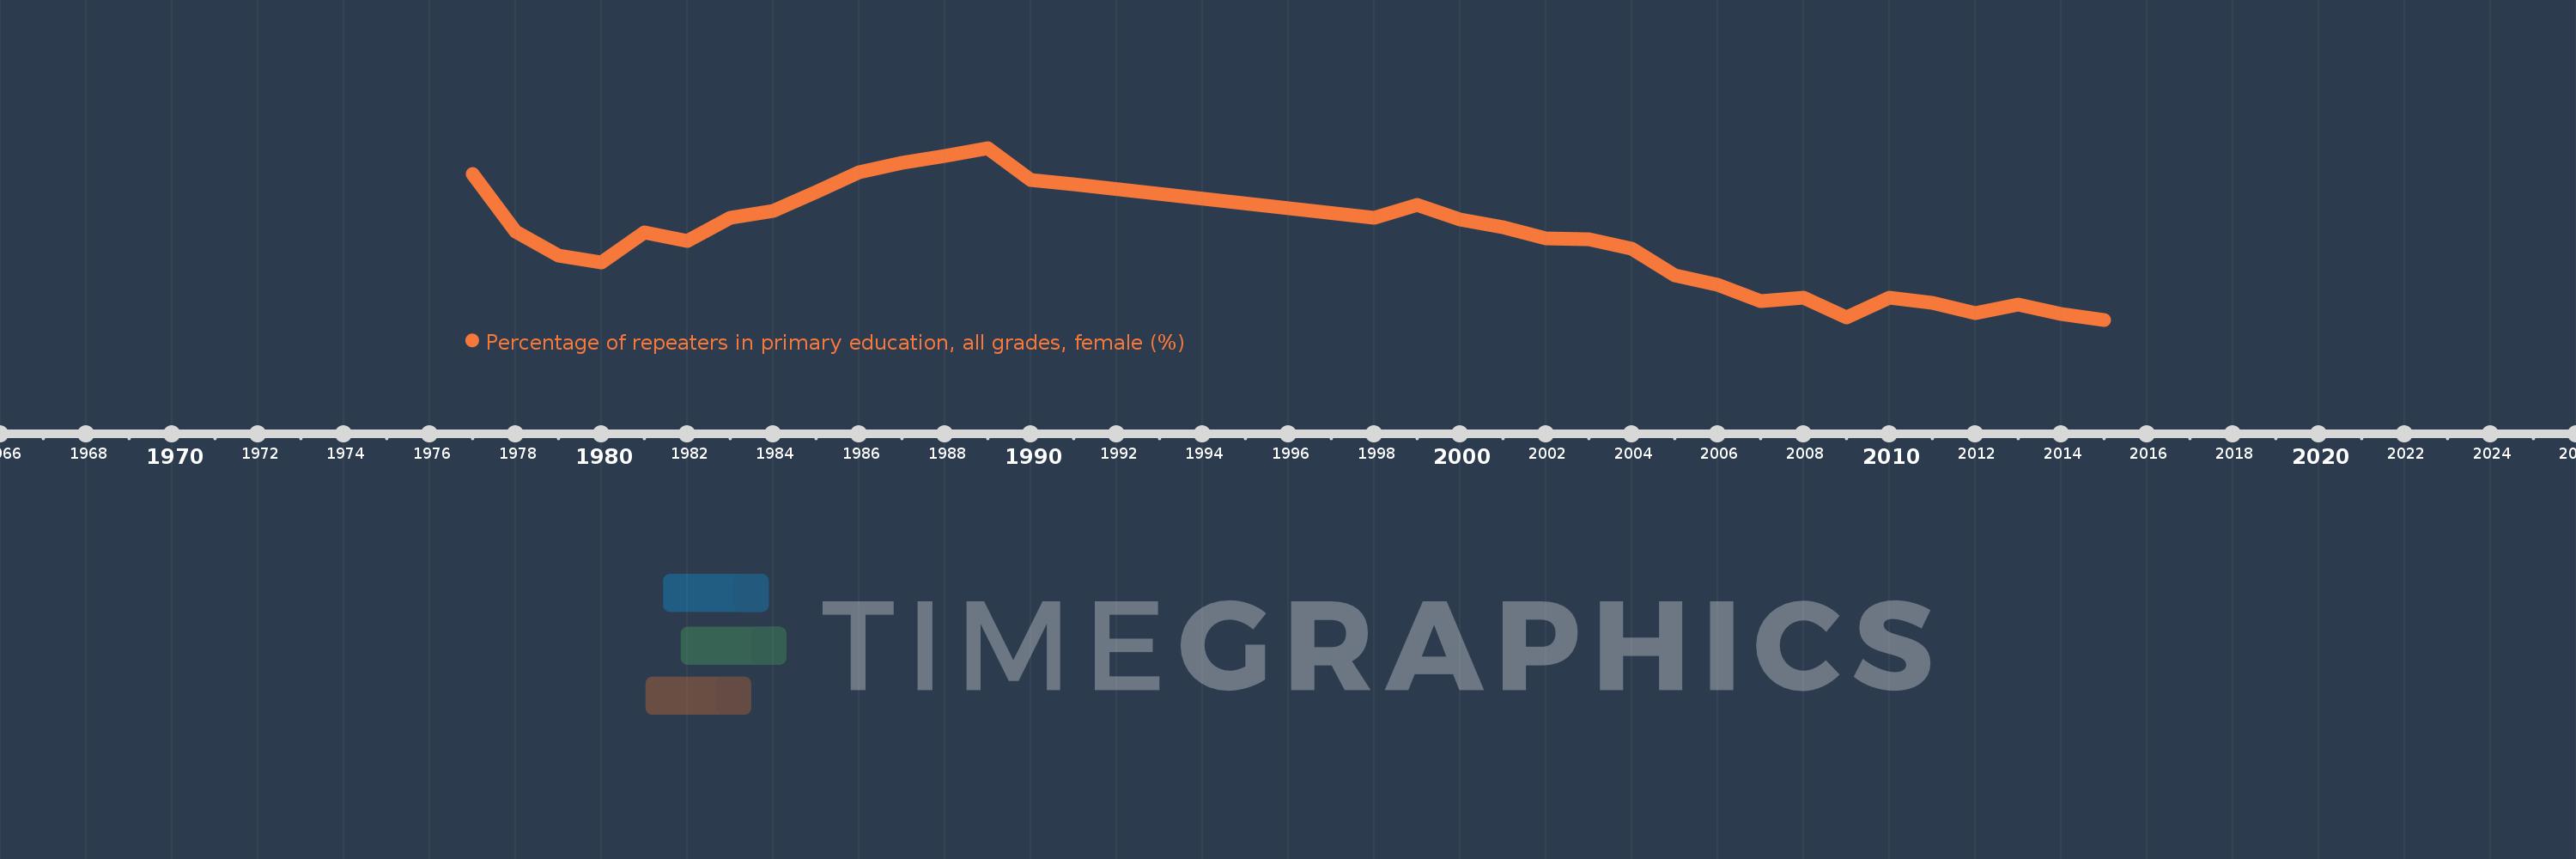
Percentage of repeaters in primary education, all grades, female (%)
2015,2014,2013,2012,2011,2010,2009,2008,2007,2006,2005,2004,2003,2002,2001,2000,1999,1998,1991,1990,1989,1988,1987,1986,1985,1984,1983,1982,1981,1980,1979,1978,1977
Estas estatísticas em outros países:
AfghanistanAlbaniaAlgeriaAndorraAngolaAntigua and BarbudaArab WorldArgentinaArmeniaArubaAustriaAzerbaijanBahamas, TheBahrainBangladeshBelarusBelgiumBelizeBeninBermudaBhutanBoliviaBosnia and HerzegovinaBotswanaBrazilBritish Virgin IslandsBrunei DarussalamBulgariaBurkina FasoBurundiCabo VerdeCambodiaCameroonCanadaCaribbean small statesCayman IslandsCentral African RepublicCentral Europe and the BalticsChadChileChinaColombiaComorosCongo, Dem. Rep.Congo, Rep.Costa RicaCote d'IvoireCroatiaCubaCyprusCzech RepublicDenmarkDjiboutiDominicaDominican RepublicEarly-demographic dividendEast Asia & PacificEast Asia & Pacific (excluding high income)East Asia & Pacific (IDA & IBRD countries)EcuadorEgypt, Arab Rep.El SalvadorEquatorial GuineaEritreaEstoniaEthiopiaEuro areaEurope & Central AsiaEurope & Central Asia (excluding high income)Europe & Central Asia (IDA & IBRD countries)European UnionFijiFinlandFragile and conflict affected situationsFranceGabonGambia, TheGeorgiaGermanyGhanaGreeceGrenadaGuatemalaGuineaGuinea-BissauGuyanaHaitiHeavily indebted poor countries (HIPC)High incomeHondurasHong Kong SAR, ChinaHungaryIBRD onlyIcelandIDA & IBRD totalIDA blendIDA onlyIDA totalIndiaIndonesiaIran, Islamic Rep.IraqIrelandIsraelItalyJamaicaJapanJordanKazakhstanKenyaKiribatiKorea, Rep.KuwaitKyrgyz RepublicLao PDRLate-demographic dividendLatin America & Caribbean Latin America & Caribbean (excluding high income)Latin America & the Caribbean (IDA & IBRD countries)LatviaLeast developed countries: UN classificationLebanonLesothoLiberiaLibyaLiechtensteinLithuaniaLow & middle incomeLow incomeLower middle incomeLuxembourgMacao SAR, ChinaMacedonia, FYRMadagascarMalawiMalaysiaMaldivesMaliMaltaMauritaniaMauritiusMexicoMiddle East & North AfricaMiddle East & North Africa (excluding high income)Middle East & North Africa (IDA & IBRD countries)Middle incomeMoldovaMonacoMongoliaMontenegroMoroccoMozambiqueMyanmarNamibiaNauruNepalNetherlandsNew ZealandNicaraguaNigerNorwayOECD membersOmanOther small statesPacific island small statesPakistanPalauPanamaPapua New GuineaParaguayPeruPhilippinesPolandPortugalPost-demographic dividendPre-demographic dividendQatarRomaniaRussian FederationRwandaSamoaSan MarinoSao Tome and PrincipeSaudi ArabiaSenegalSerbiaSeychellesSierra LeoneSingaporeSint Maarten (Dutch part)Slovak RepublicSloveniaSmall statesSolomon IslandsSomaliaSouth AfricaSouth AsiaSouth Asia (IDA & IBRD)South SudanSpainSri LankaSt. Kitts and NevisSt. LuciaSt. Vincent and the GrenadinesSub-Saharan Africa Sub-Saharan Africa (excluding high income)Sub-Saharan Africa (IDA & IBRD countries)SudanSurinameSwazilandSwedenSwitzerlandSyrian Arab RepublicTajikistanTanzaniaThailandTimor-LesteTogoTongaTrinidad and TobagoTunisiaTurkeyTurks and Caicos IslandsTuvaluUgandaUkraineUnited Arab EmiratesUnited KingdomUpper middle incomeUruguayUzbekistanVanuatuVenezuela, RBVietnamWest Bank and GazaWorldYemen, Rep.ZambiaZimbabwe Linha do tempo:
Nesta escala de tempo está apresentado um gráfico de 1977 ano até 2015 ano Hungary. Dados de 1976 ano ausente. O número de observações reais por data: 33.
Fonte (nome):
Indicadores de desenvolvimento mundial
Fonte (organização):
UNESCO Institute for Statistics
Categorias:
Education, Gender
Foi atualizado:
23 abr 2017 ano
Indicadores de alterações dos valores ao longo dos anos
Mínimo:
1.402
1 jan 2015 ano
Máximo:
2.73
1 jan 1989 ano
Na data de observação
Valor
Mudança absoluta
A alteração em relação ao valor anterior
1 jan 1977 ano
2.53
+2.53
0.0%
1 jan 1978 ano
2.087
-0.443
-17.51%
1 jan 1979 ano
1.898
-0.189
-9.06%
1 jan 1980 ano
1.843
-0.055
-2.89%
1 jan 1981 ano
2.078
+0.234
12.72%
1 jan 1982 ano
2.011
-0.066
-3.18%
1 jan 1983 ano
2.192
+0.181
8.99%
1 jan 1984 ano
2.245
+0.053
2.42%
1 jan 1985 ano
2.389
+0.143
6.38%
1 jan 1986 ano
2.544
+0.155
6.51%
1 jan 1987 ano
2.614
+0.07
2.75%
1 jan 1988 ano
2.667
+0.053
2.03%
1 jan 1989 ano
2.73
+0.063
2.36%
1 jan 1990 ano
2.481
-0.249
-9.12%
1 jan 1991 ano
2.452
-0.029
-1.17%
1 jan 1998 ano
2.191
-0.26
-10.62%
1 jan 1999 ano
2.291
+0.1
4.56%
1 jan 2000 ano
2.177
-0.114
-4.99%
1 jan 2001 ano
2.117
-0.06
-2.77%
1 jan 2002 ano
2.034
-0.082
-3.88%
1 jan 2003 ano
2.021
-0.013
-0.64%
1 jan 2004 ano
1.951
-0.071
-3.49%
1 jan 2005 ano
1.747
-0.204
-10.44%
1 jan 2006 ano
1.672
-0.075
-4.31%
1 jan 2007 ano
1.549
-0.123
-7.36%
1 jan 2008 ano
1.573
+0.024
1.58%
1 jan 2009 ano
1.417
-0.156
-9.9%
1 jan 2010 ano
1.574
+0.157
11.05%
1 jan 2011 ano
1.535
-0.039
-2.48%
1 jan 2012 ano
1.452
-0.083
-5.38%
1 jan 2013 ano
1.518
+0.066
4.52%
1 jan 2014 ano
1.444
-0.074
-4.88%
1 jan 2015 ano
1.402
-0.042
-2.9%
Classificação de países por estatísticas atuais por anos


Comentários: