29
/pt/
pt
AIzaSyAYiBZKx7MnpbEhh9jyipgxe19OcubqV5w
April 1, 2024
62189
Upper middle income
UMC
false
2
1
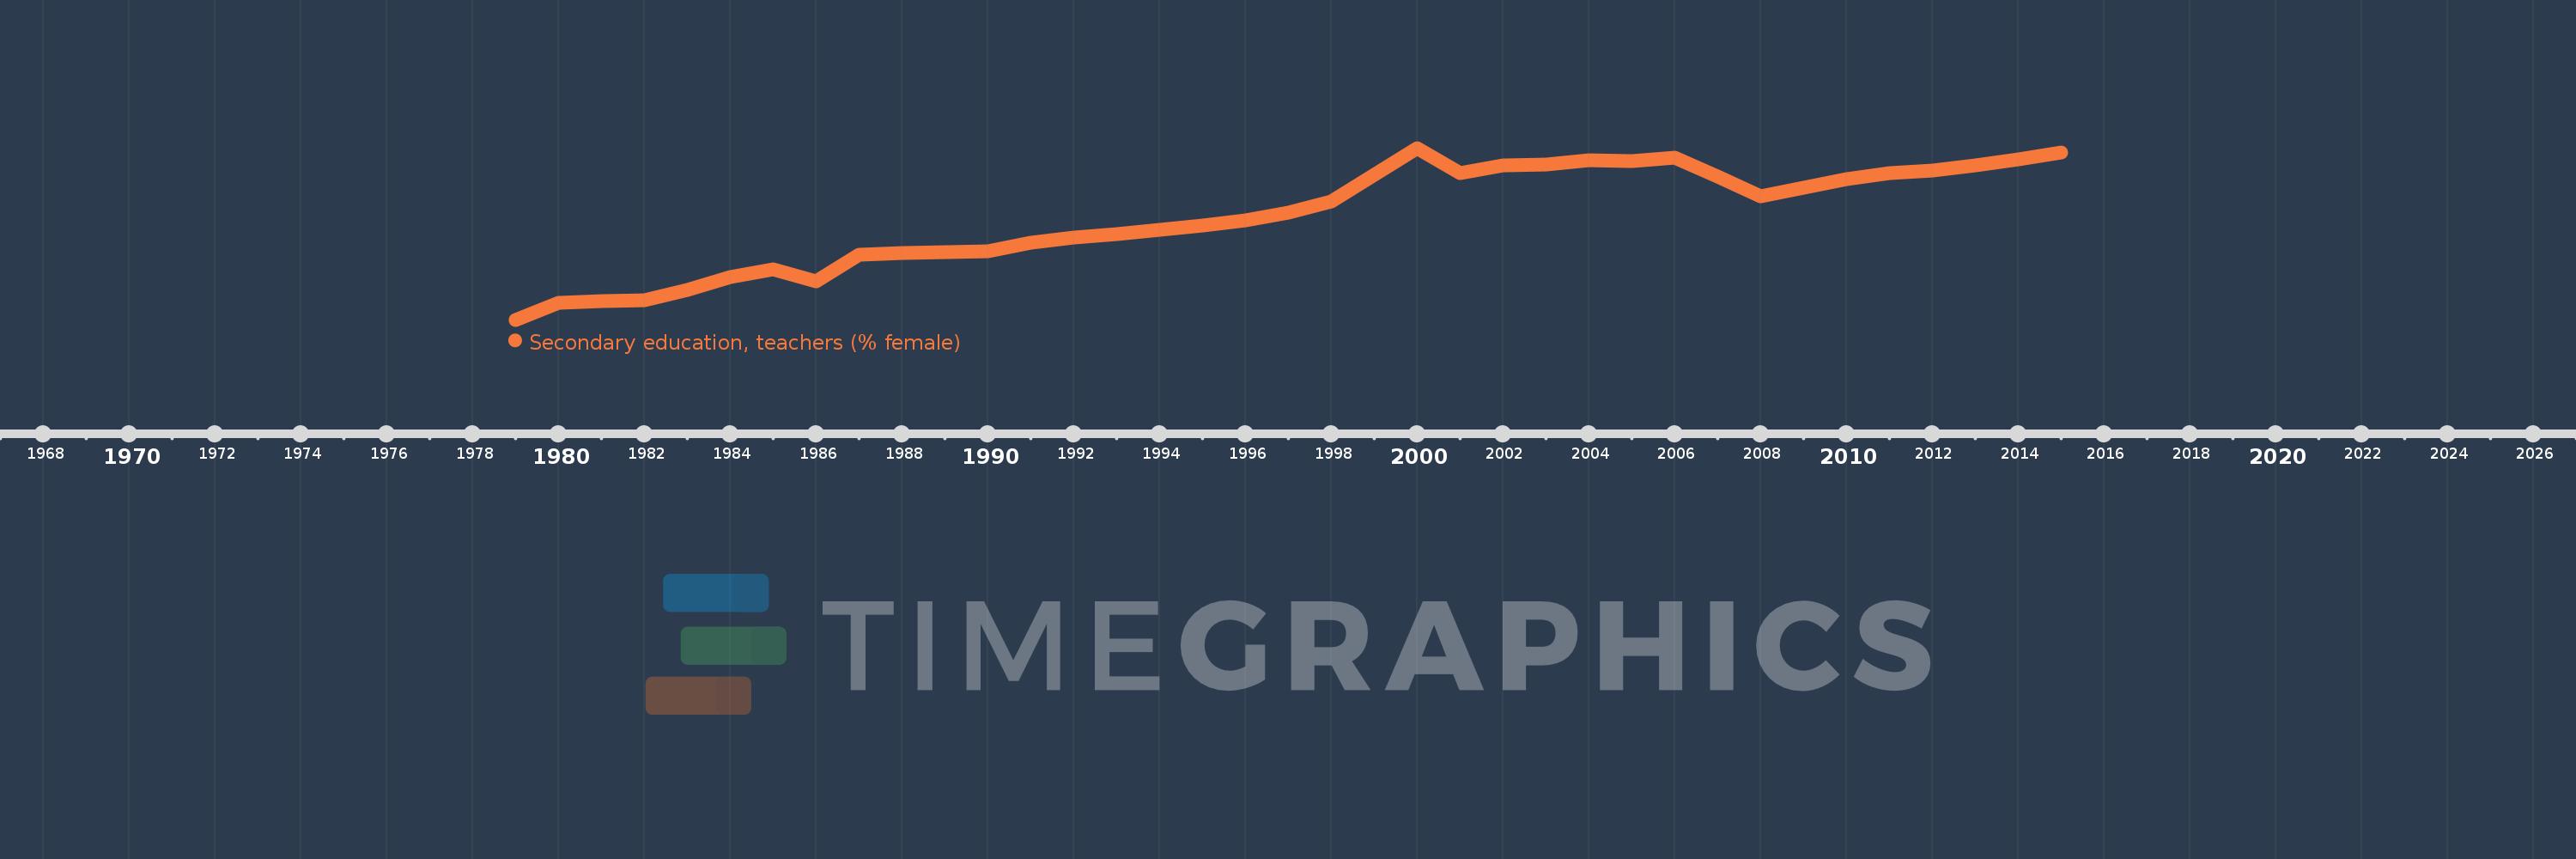
Secondary education, teachers (% female)
2015,2014,2013,2012,2011,2010,2009,2008,2007,2006,2005,2004,2003,2002,2001,2000,1999,1998,1997,1996,1995,1994,1993,1992,1991,1990,1989,1988,1987,1986,1985,1984,1983,1982,1981,1980,1979
Estas estatísticas em outros países:
AfghanistanAlbaniaAlgeriaAndorraAngolaAntigua and BarbudaArab WorldArgentinaArmeniaArubaAustraliaAustriaBahamas, TheBahrainBangladeshBarbadosBelarusBelgiumBelizeBeninBermudaBhutanBoliviaBosnia and HerzegovinaBotswanaBrazilBritish Virgin IslandsBrunei DarussalamBulgariaBurkina FasoBurundiCabo VerdeCambodiaCameroonCanadaCaribbean small statesCayman IslandsCentral African RepublicCentral Europe and the BalticsChadChileChinaColombiaComorosCongo, Dem. Rep.Congo, Rep.Costa RicaCote d'IvoireCroatiaCubaCyprusCzech RepublicDenmarkDjiboutiDominicaDominican RepublicEarly-demographic dividendEast Asia & PacificEast Asia & Pacific (excluding high income)East Asia & Pacific (IDA & IBRD countries)EcuadorEgypt, Arab Rep.El SalvadorEquatorial GuineaEritreaEstoniaEthiopiaEuro areaEurope & Central AsiaEurope & Central Asia (excluding high income)Europe & Central Asia (IDA & IBRD countries)European UnionFijiFinlandFragile and conflict affected situationsFranceGabonGambia, TheGeorgiaGermanyGhanaGibraltarGreeceGrenadaGuatemalaGuineaGuinea-BissauGuyanaHeavily indebted poor countries (HIPC)High incomeHondurasHong Kong SAR, ChinaHungaryIBRD onlyIcelandIDA & IBRD totalIDA blendIDA onlyIDA totalIndiaIndonesiaIran, Islamic Rep.IraqIrelandIsraelItalyJamaicaJapanJordanKazakhstanKenyaKiribatiKorea, Dem. People’s Rep.Korea, Rep.KuwaitKyrgyz RepublicLao PDRLate-demographic dividendLatin America & Caribbean Latin America & Caribbean (excluding high income)Latin America & the Caribbean (IDA & IBRD countries)LatviaLeast developed countries: UN classificationLebanonLesothoLiberiaLibyaLiechtensteinLithuaniaLow & middle incomeLow incomeLower middle incomeLuxembourgMacao SAR, ChinaMacedonia, FYRMadagascarMalawiMalaysiaMaldivesMaliMaltaMarshall IslandsMauritaniaMauritiusMexicoMiddle East & North AfricaMiddle East & North Africa (excluding high income)Middle East & North Africa (IDA & IBRD countries)Middle incomeMoldovaMonacoMongoliaMoroccoMozambiqueMyanmarNamibiaNauruNepalNetherlandsNew ZealandNicaraguaNigerNigeriaNorth AmericaNorwayOECD membersOmanOther small statesPacific island small statesPakistanPalauPanamaPapua New GuineaParaguayPeruPhilippinesPolandPortugalPost-demographic dividendPre-demographic dividendPuerto RicoQatarRomaniaRussian FederationRwandaSamoaSan MarinoSao Tome and PrincipeSaudi ArabiaSenegalSerbiaSeychellesSierra LeoneSingaporeSint Maarten (Dutch part)Slovak RepublicSloveniaSmall statesSolomon IslandsSomaliaSouth AfricaSouth AsiaSouth Asia (IDA & IBRD)SpainSri LankaSt. Kitts and NevisSt. LuciaSt. Vincent and the GrenadinesSub-Saharan Africa Sub-Saharan Africa (excluding high income)Sub-Saharan Africa (IDA & IBRD countries)SudanSurinameSwazilandSwedenSwitzerlandSyrian Arab RepublicTajikistanTanzaniaThailandTimor-LesteTogoTongaTrinidad and TobagoTunisiaTurkeyTurks and Caicos IslandsUgandaUkraineUnited Arab EmiratesUnited KingdomUnited StatesUpper middle incomeUruguayUzbekistanVanuatuVenezuela, RBVietnamWest Bank and GazaWorldYemen, Rep.ZambiaZimbabwe Linha do tempo:
Nesta escala de tempo está apresentado um gráfico de 1979 ano até 2015 ano Upper middle income. Dados de 1978 ano ausente. O número de observações reais por data: 37.
Fonte (nome):
Indicadores de desenvolvimento mundial
Fonte (organização):
United Nations Educational, Scientific, and Cultural Organization (UNESCO) Institute for Statistics.
Categorias:
Education, Gender
Foi atualizado:
23 abr 2017 ano
Indicadores de alterações dos valores ao longo dos anos
Mínimo:
47.238
1 jan 1979 ano
Máximo:
57.176
1 jan 2000 ano
Na data de observação
Valor
Mudança absoluta
A alteração em relação ao valor anterior
1 jan 1979 ano
47.238
+47.238
0.0%
1 jan 1980 ano
48.193
+0.955
2.02%
1 jan 1981 ano
48.328
+0.135
0.28%
1 jan 1982 ano
48.343
+0.015
0.03%
1 jan 1983 ano
48.977
+0.633
1.31%
1 jan 1984 ano
49.723
+0.746
1.52%
1 jan 1985 ano
50.16
+0.438
0.88%
1 jan 1986 ano
49.454
-0.706
-1.41%
1 jan 1987 ano
51.016
+1.562
3.16%
1 jan 1988 ano
51.095
+0.079
0.16%
1 jan 1989 ano
51.148
+0.052
0.1%
1 jan 1990 ano
51.209
+0.061
0.12%
1 jan 1991 ano
51.682
+0.473
0.92%
1 jan 1992 ano
51.999
+0.317
0.61%
1 jan 1993 ano
52.189
+0.19
0.36%
1 jan 1994 ano
52.417
+0.229
0.44%
1 jan 1995 ano
52.677
+0.259
0.49%
1 jan 1996 ano
52.976
+0.299
0.57%
1 jan 1997 ano
53.43
+0.455
0.86%
1 jan 1998 ano
54.084
+0.654
1.22%
1 jan 1999 ano
55.62
+1.536
2.84%
1 jan 2000 ano
57.176
+1.556
2.8%
1 jan 2001 ano
55.717
-1.459
-2.55%
1 jan 2002 ano
56.144
+0.427
0.77%
1 jan 2003 ano
56.198
+0.054
0.1%
1 jan 2004 ano
56.444
+0.246
0.44%
1 jan 2005 ano
56.414
-0.03
-0.05%
1 jan 2006 ano
56.615
+0.201
0.36%
1 jan 2007 ano
55.517
-1.098
-1.94%
1 jan 2008 ano
54.357
-1.16
-2.09%
1 jan 2009 ano
54.888
+0.531
0.98%
1 jan 2010 ano
55.379
+0.491
0.9%
1 jan 2011 ano
55.709
+0.33
0.6%
1 jan 2012 ano
55.857
+0.147
0.26%
1 jan 2013 ano
56.171
+0.315
0.56%
1 jan 2014 ano
56.526
+0.355
0.63%
1 jan 2015 ano
56.913
+0.387
0.69%
Classificação de países por estatísticas atuais por anos


Comentários: