29
/pt/
pt
AIzaSyAYiBZKx7MnpbEhh9jyipgxe19OcubqV5w
April 1, 2024
117402
Cyprus
CYP
true
2
1
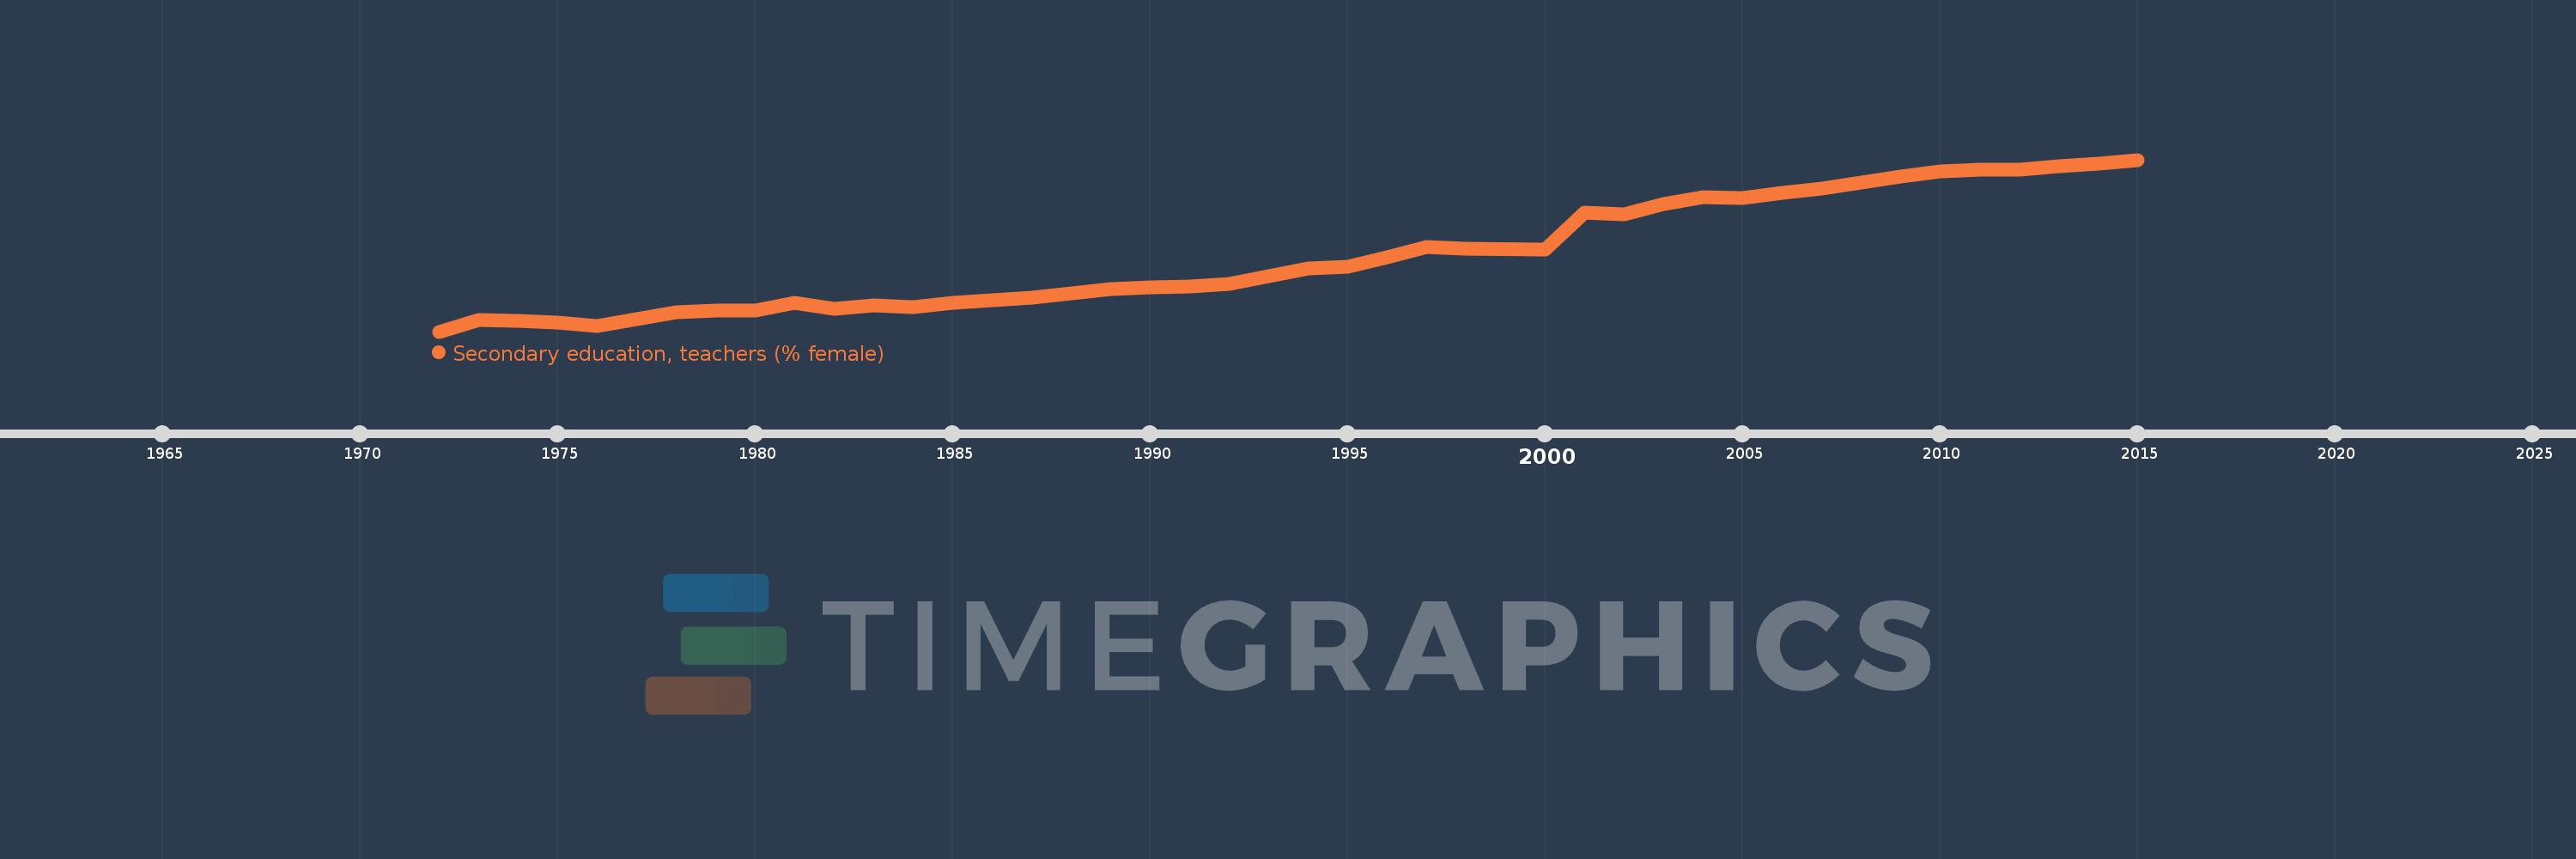
Secondary education, teachers (% female)
2015,2014,2013,2012,2011,2010,2009,2008,2007,2006,2005,2004,2003,2002,2001,2000,1998,1997,1996,1995,1994,1993,1992,1991,1990,1989,1988,1987,1986,1985,1984,1983,1982,1981,1980,1979,1978,1977,1976,1975,1974,1973,1972
Estas estatísticas em outros países:
AfghanistanAlbaniaAlgeriaAndorraAngolaAntigua and BarbudaArab WorldArgentinaArmeniaArubaAustraliaAustriaBahamas, TheBahrainBangladeshBarbadosBelarusBelgiumBelizeBeninBermudaBhutanBoliviaBosnia and HerzegovinaBotswanaBrazilBritish Virgin IslandsBrunei DarussalamBulgariaBurkina FasoBurundiCabo VerdeCambodiaCameroonCanadaCaribbean small statesCayman IslandsCentral African RepublicCentral Europe and the BalticsChadChileChinaColombiaComorosCongo, Dem. Rep.Congo, Rep.Costa RicaCote d'IvoireCroatiaCubaCyprusCzech RepublicDenmarkDjiboutiDominicaDominican RepublicEarly-demographic dividendEast Asia & PacificEast Asia & Pacific (excluding high income)East Asia & Pacific (IDA & IBRD countries)EcuadorEgypt, Arab Rep.El SalvadorEquatorial GuineaEritreaEstoniaEthiopiaEuro areaEurope & Central AsiaEurope & Central Asia (excluding high income)Europe & Central Asia (IDA & IBRD countries)European UnionFijiFinlandFragile and conflict affected situationsFranceGabonGambia, TheGeorgiaGermanyGhanaGibraltarGreeceGrenadaGuatemalaGuineaGuinea-BissauGuyanaHeavily indebted poor countries (HIPC)High incomeHondurasHong Kong SAR, ChinaHungaryIBRD onlyIcelandIDA & IBRD totalIDA blendIDA onlyIDA totalIndiaIndonesiaIran, Islamic Rep.IraqIrelandIsraelItalyJamaicaJapanJordanKazakhstanKenyaKiribatiKorea, Dem. People’s Rep.Korea, Rep.KuwaitKyrgyz RepublicLao PDRLate-demographic dividendLatin America & Caribbean Latin America & Caribbean (excluding high income)Latin America & the Caribbean (IDA & IBRD countries)LatviaLeast developed countries: UN classificationLebanonLesothoLiberiaLibyaLiechtensteinLithuaniaLow & middle incomeLow incomeLower middle incomeLuxembourgMacao SAR, ChinaMacedonia, FYRMadagascarMalawiMalaysiaMaldivesMaliMaltaMarshall IslandsMauritaniaMauritiusMexicoMiddle East & North AfricaMiddle East & North Africa (excluding high income)Middle East & North Africa (IDA & IBRD countries)Middle incomeMoldovaMonacoMongoliaMoroccoMozambiqueMyanmarNamibiaNauruNepalNetherlandsNew ZealandNicaraguaNigerNigeriaNorth AmericaNorwayOECD membersOmanOther small statesPacific island small statesPakistanPalauPanamaPapua New GuineaParaguayPeruPhilippinesPolandPortugalPost-demographic dividendPre-demographic dividendPuerto RicoQatarRomaniaRussian FederationRwandaSamoaSan MarinoSao Tome and PrincipeSaudi ArabiaSenegalSerbiaSeychellesSierra LeoneSingaporeSint Maarten (Dutch part)Slovak RepublicSloveniaSmall statesSolomon IslandsSomaliaSouth AfricaSouth AsiaSouth Asia (IDA & IBRD)SpainSri LankaSt. Kitts and NevisSt. LuciaSt. Vincent and the GrenadinesSub-Saharan Africa Sub-Saharan Africa (excluding high income)Sub-Saharan Africa (IDA & IBRD countries)SudanSurinameSwazilandSwedenSwitzerlandSyrian Arab RepublicTajikistanTanzaniaThailandTimor-LesteTogoTongaTrinidad and TobagoTunisiaTurkeyTurks and Caicos IslandsUgandaUkraineUnited Arab EmiratesUnited KingdomUnited StatesUpper middle incomeUruguayUzbekistanVanuatuVenezuela, RBVietnamWest Bank and GazaWorldYemen, Rep.ZambiaZimbabwe Linha do tempo:
Nesta escala de tempo está apresentado um gráfico de 1972 ano até 2015 ano Cyprus. Dados de 1971 ano ausente. O número de observações reais por data: 43.
Fonte (nome):
Indicadores de desenvolvimento mundial
Fonte (organização):
United Nations Educational, Scientific, and Cultural Organization (UNESCO) Institute for Statistics.
Categorias:
Education, Gender
Foi atualizado:
23 abr 2017 ano
Indicadores de alterações dos valores ao longo dos anos
Mínimo:
38.19
1 jan 1972 ano
Máximo:
65.716
1 jan 2015 ano
Na data de observação
Valor
Mudança absoluta
A alteração em relação ao valor anterior
1 jan 1972 ano
38.19
+38.19
0.0%
1 jan 1973 ano
39.981
+1.791
4.69%
1 jan 1974 ano
39.871
-0.11
-0.28%
1 jan 1975 ano
39.575
-0.296
-0.74%
1 jan 1976 ano
39.117
-0.458
-1.16%
1 jan 1977 ano
40.188
+1.071
2.74%
1 jan 1978 ano
41.32
+1.132
2.82%
1 jan 1979 ano
41.611
+0.291
0.71%
1 jan 1980 ano
41.5
-0.111
-0.27%
1 jan 1981 ano
42.814
+1.313
3.16%
1 jan 1982 ano
41.89
-0.924
-2.16%
1 jan 1983 ano
42.37
+0.48
1.15%
1 jan 1984 ano
42.063
-0.307
-0.72%
1 jan 1985 ano
42.78
+0.717
1.7%
1 jan 1986 ano
43.255
+0.475
1.11%
1 jan 1987 ano
43.563
+0.308
0.71%
1 jan 1988 ano
44.277
+0.714
1.64%
1 jan 1989 ano
44.937
+0.66
1.49%
1 jan 1990 ano
45.289
+0.353
0.78%
1 jan 1991 ano
45.374
+0.085
0.19%
1 jan 1992 ano
45.783
+0.409
0.9%
1 jan 1993 ano
47.039
+1.256
2.74%
1 jan 1994 ano
48.304
+1.265
2.69%
1 jan 1995 ano
48.643
+0.339
0.7%
1 jan 1996 ano
50.054
+1.411
2.9%
1 jan 1997 ano
51.792
+1.739
3.47%
1 jan 1998 ano
51.419
-0.374
-0.72%
1 jan 2000 ano
51.306
-0.113
-0.22%
1 jan 2001 ano
57.274
+5.968
11.63%
1 jan 2002 ano
57.007
-0.268
-0.47%
1 jan 2003 ano
58.634
+1.628
2.86%
1 jan 2004 ano
59.782
+1.148
1.96%
1 jan 2005 ano
59.589
-0.194
-0.32%
1 jan 2006 ano
60.467
+0.879
1.47%
1 jan 2007 ano
61.071
+0.604
1.0%
1 jan 2008 ano
62.008
+0.937
1.53%
1 jan 2009 ano
62.994
+0.986
1.59%
1 jan 2010 ano
63.836
+0.842
1.34%
1 jan 2011 ano
64.174
+0.338
0.53%
1 jan 2012 ano
64.105
-0.07
-0.11%
1 jan 2013 ano
64.748
+0.644
1.0%
1 jan 2014 ano
65.028
+0.28
0.43%
1 jan 2015 ano
65.716
+0.688
1.06%
Classificação de países por estatísticas atuais por anos


Comentários: