29
/pt/
pt
AIzaSyAYiBZKx7MnpbEhh9jyipgxe19OcubqV5w
April 1, 2024
142312
Greece
GRC
true
2
1
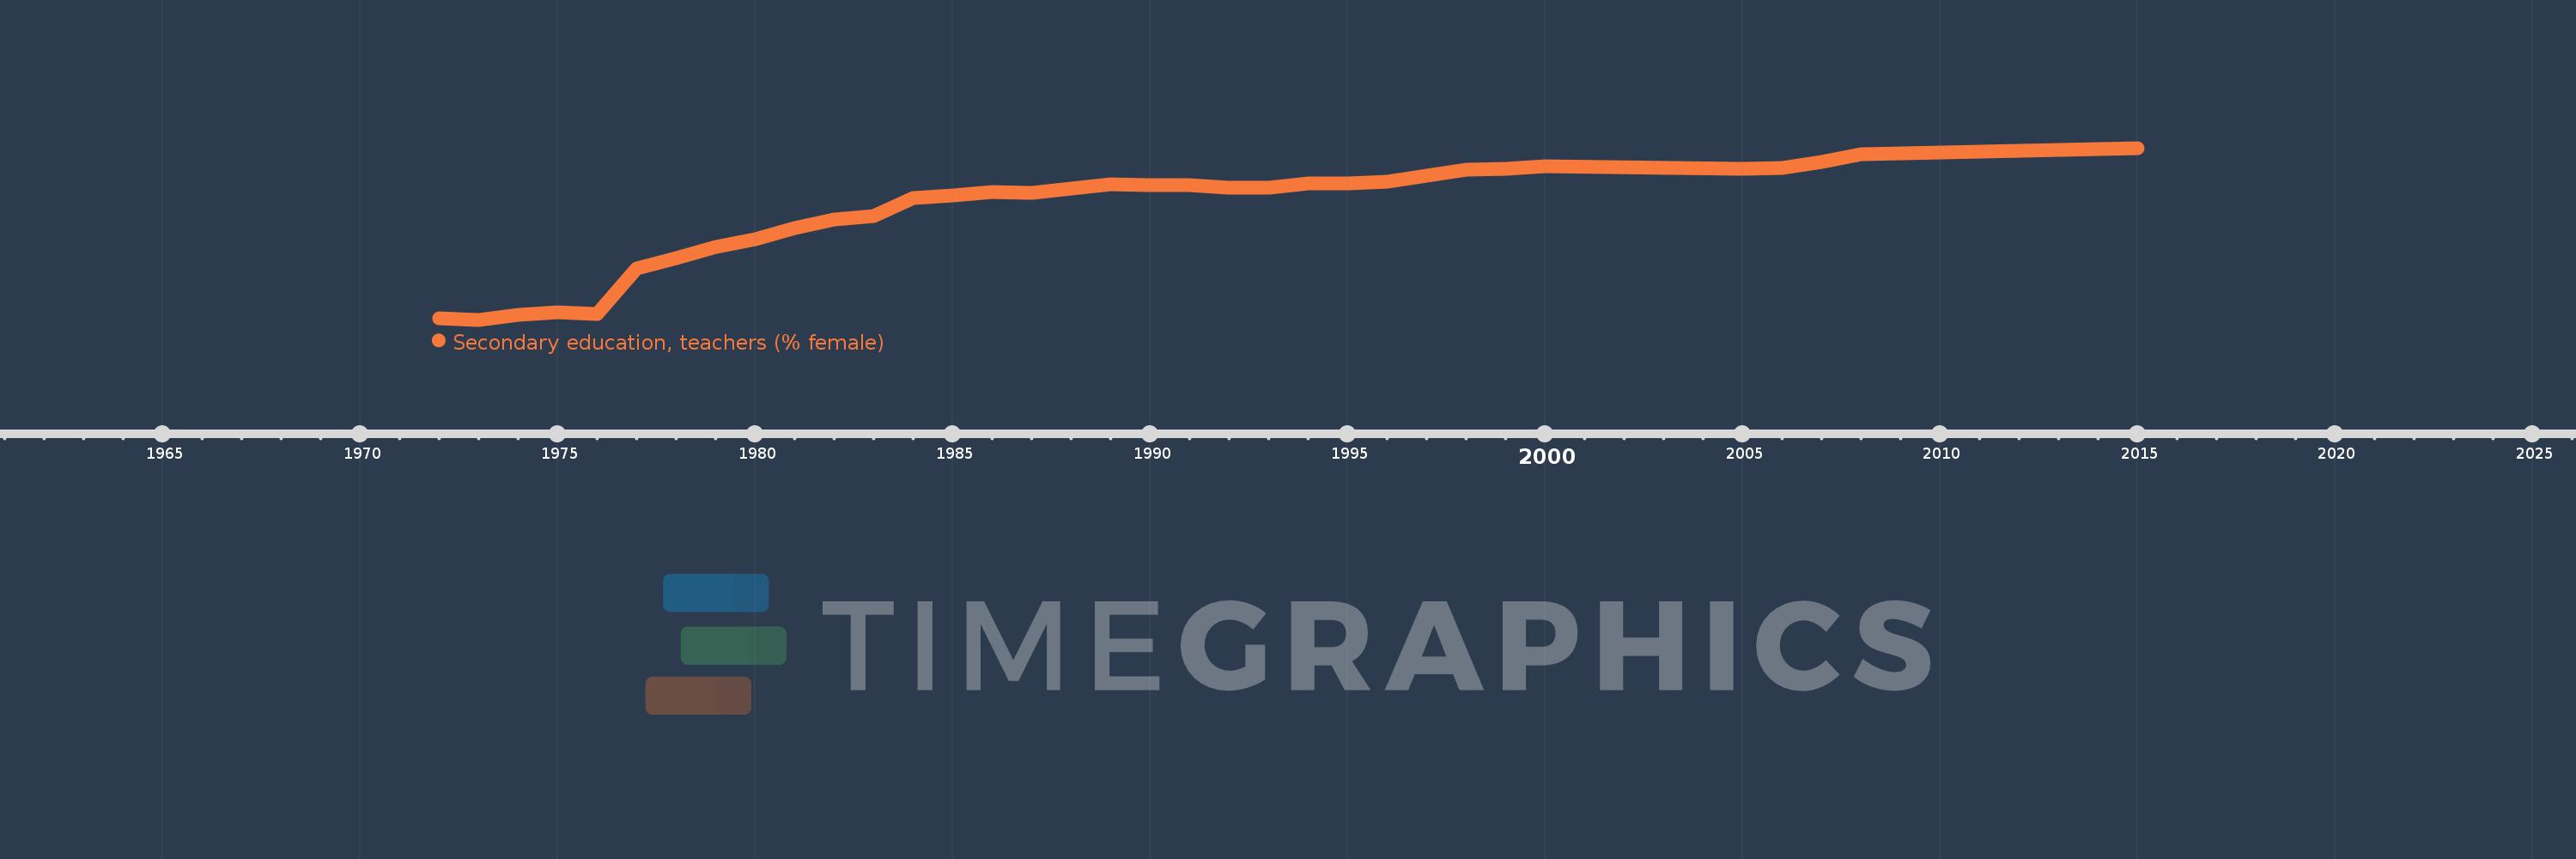
Secondary education, teachers (% female)
2015,2008,2007,2006,2005,2000,1999,1998,1997,1996,1995,1994,1993,1992,1991,1990,1989,1988,1987,1986,1985,1984,1983,1982,1981,1980,1979,1978,1977,1976,1975,1974,1973,1972
Estas estatísticas em outros países:
AfghanistanAlbaniaAlgeriaAndorraAngolaAntigua and BarbudaArab WorldArgentinaArmeniaArubaAustraliaAustriaBahamas, TheBahrainBangladeshBarbadosBelarusBelgiumBelizeBeninBermudaBhutanBoliviaBosnia and HerzegovinaBotswanaBrazilBritish Virgin IslandsBrunei DarussalamBulgariaBurkina FasoBurundiCabo VerdeCambodiaCameroonCanadaCaribbean small statesCayman IslandsCentral African RepublicCentral Europe and the BalticsChadChileChinaColombiaComorosCongo, Dem. Rep.Congo, Rep.Costa RicaCote d'IvoireCroatiaCubaCyprusCzech RepublicDenmarkDjiboutiDominicaDominican RepublicEarly-demographic dividendEast Asia & PacificEast Asia & Pacific (excluding high income)East Asia & Pacific (IDA & IBRD countries)EcuadorEgypt, Arab Rep.El SalvadorEquatorial GuineaEritreaEstoniaEthiopiaEuro areaEurope & Central AsiaEurope & Central Asia (excluding high income)Europe & Central Asia (IDA & IBRD countries)European UnionFijiFinlandFragile and conflict affected situationsFranceGabonGambia, TheGeorgiaGermanyGhanaGibraltarGreeceGrenadaGuatemalaGuineaGuinea-BissauGuyanaHeavily indebted poor countries (HIPC)High incomeHondurasHong Kong SAR, ChinaHungaryIBRD onlyIcelandIDA & IBRD totalIDA blendIDA onlyIDA totalIndiaIndonesiaIran, Islamic Rep.IraqIrelandIsraelItalyJamaicaJapanJordanKazakhstanKenyaKiribatiKorea, Dem. People’s Rep.Korea, Rep.KuwaitKyrgyz RepublicLao PDRLate-demographic dividendLatin America & Caribbean Latin America & Caribbean (excluding high income)Latin America & the Caribbean (IDA & IBRD countries)LatviaLeast developed countries: UN classificationLebanonLesothoLiberiaLibyaLiechtensteinLithuaniaLow & middle incomeLow incomeLower middle incomeLuxembourgMacao SAR, ChinaMacedonia, FYRMadagascarMalawiMalaysiaMaldivesMaliMaltaMarshall IslandsMauritaniaMauritiusMexicoMiddle East & North AfricaMiddle East & North Africa (excluding high income)Middle East & North Africa (IDA & IBRD countries)Middle incomeMoldovaMonacoMongoliaMoroccoMozambiqueMyanmarNamibiaNauruNepalNetherlandsNew ZealandNicaraguaNigerNigeriaNorth AmericaNorwayOECD membersOmanOther small statesPacific island small statesPakistanPalauPanamaPapua New GuineaParaguayPeruPhilippinesPolandPortugalPost-demographic dividendPre-demographic dividendPuerto RicoQatarRomaniaRussian FederationRwandaSamoaSan MarinoSao Tome and PrincipeSaudi ArabiaSenegalSerbiaSeychellesSierra LeoneSingaporeSint Maarten (Dutch part)Slovak RepublicSloveniaSmall statesSolomon IslandsSomaliaSouth AfricaSouth AsiaSouth Asia (IDA & IBRD)SpainSri LankaSt. Kitts and NevisSt. LuciaSt. Vincent and the GrenadinesSub-Saharan Africa Sub-Saharan Africa (excluding high income)Sub-Saharan Africa (IDA & IBRD countries)SudanSurinameSwazilandSwedenSwitzerlandSyrian Arab RepublicTajikistanTanzaniaThailandTimor-LesteTogoTongaTrinidad and TobagoTunisiaTurkeyTurks and Caicos IslandsUgandaUkraineUnited Arab EmiratesUnited KingdomUnited StatesUpper middle incomeUruguayUzbekistanVanuatuVenezuela, RBVietnamWest Bank and GazaWorldYemen, Rep.ZambiaZimbabwe Linha do tempo:
Nesta escala de tempo está apresentado um gráfico de 1972 ano até 2015 ano Greece. Dados de 1971 ano ausente. O número de observações reais por data: 34.
Fonte (nome):
Indicadores de desenvolvimento mundial
Fonte (organização):
United Nations Educational, Scientific, and Cultural Organization (UNESCO) Institute for Statistics.
Categorias:
Education, Gender
Foi atualizado:
23 abr 2017 ano
Indicadores de alterações dos valores ao longo dos anos
Mínimo:
36.262
1 jan 1973 ano
Máximo:
58.322
1 jan 2015 ano
Na data de observação
Valor
Mudança absoluta
A alteração em relação ao valor anterior
1 jan 1972 ano
36.424
+36.424
0.0%
1 jan 1973 ano
36.262
-0.162
-0.45%
1 jan 1974 ano
36.855
+0.593
1.64%
1 jan 1975 ano
37.178
+0.323
0.88%
1 jan 1976 ano
36.992
-0.186
-0.5%
1 jan 1977 ano
42.795
+5.803
15.69%
1 jan 1978 ano
44.149
+1.355
3.17%
1 jan 1979 ano
45.596
+1.446
3.28%
1 jan 1980 ano
46.544
+0.948
2.08%
1 jan 1981 ano
48.03
+1.486
3.19%
1 jan 1982 ano
49.099
+1.069
2.23%
1 jan 1983 ano
49.553
+0.454
0.92%
1 jan 1984 ano
51.928
+2.375
4.79%
1 jan 1985 ano
52.218
+0.29
0.56%
1 jan 1986 ano
52.658
+0.44
0.84%
1 jan 1987 ano
52.542
-0.116
-0.22%
1 jan 1988 ano
53.12
+0.577
1.1%
1 jan 1989 ano
53.628
+0.509
0.96%
1 jan 1990 ano
53.539
-0.089
-0.17%
1 jan 1991 ano
53.523
-0.016
-0.03%
1 jan 1992 ano
53.16
-0.363
-0.68%
1 jan 1993 ano
53.194
+0.034
0.06%
1 jan 1994 ano
53.719
+0.524
0.99%
1 jan 1995 ano
53.8
+0.081
0.15%
1 jan 1996 ano
54.01
+0.21
0.39%
1 jan 1997 ano
54.777
+0.767
1.42%
1 jan 1998 ano
55.545
+0.768
1.4%
1 jan 1999 ano
55.675
+0.13
0.23%
1 jan 2000 ano
55.996
+0.321
0.58%
1 jan 2005 ano
55.692
-0.303
-0.54%
1 jan 2006 ano
55.804
+0.111
0.2%
1 jan 2007 ano
56.504
+0.7
1.25%
1 jan 2008 ano
57.537
+1.033
1.83%
1 jan 2015 ano
58.322
+0.785
1.36%
Classificação de países por estatísticas atuais por anos


Comentários: