29
/pt/
pt
AIzaSyAYiBZKx7MnpbEhh9jyipgxe19OcubqV5w
April 1, 2024
60626
Sub-Saharan Africa (IDA & IBRD countries)
TSS
false
2
1
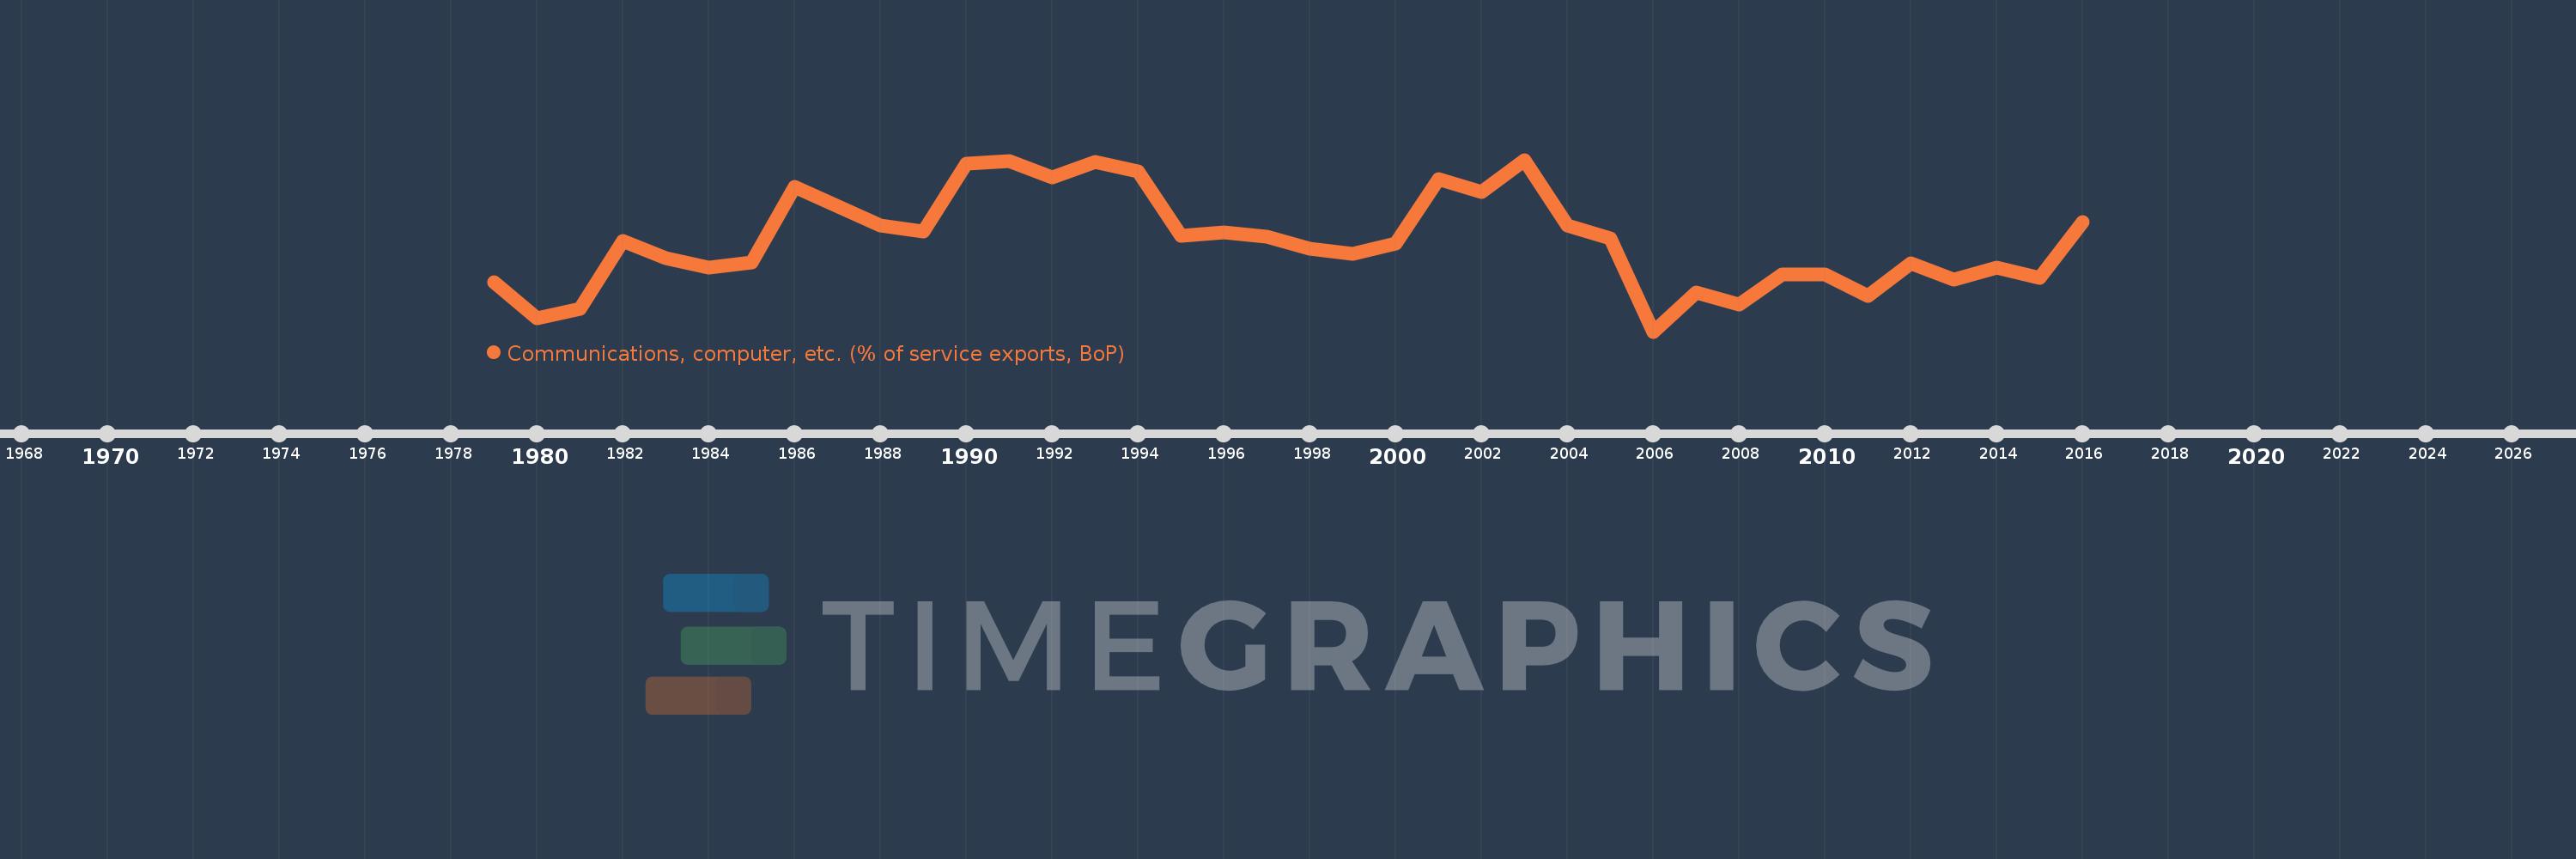
Communications, computer, etc. (% of service exports, BoP)
2016,2015,2014,2013,2012,2011,2010,2009,2008,2007,2006,2005,2004,2003,2002,2001,2000,1999,1998,1997,1996,1995,1994,1993,1992,1991,1990,1989,1988,1986,1985,1984,1983,1982,1981,1980,1979
Estas estatísticas em outros países:
AfghanistanAlbaniaAlgeriaAngolaAntigua and BarbudaArab WorldArgentinaArmeniaArubaAustraliaAustriaAzerbaijanBahamas, TheBahrainBangladeshBarbadosBelarusBelgiumBelizeBeninBermudaBhutanBoliviaBosnia and HerzegovinaBotswanaBrazilBrunei DarussalamBulgariaBurkina FasoBurundiCabo VerdeCambodiaCameroonCanadaCaribbean small statesCentral African RepublicCentral Europe and the BalticsChadChileChinaColombiaComorosCongo, Dem. Rep.Congo, Rep.Costa RicaCote d'IvoireCroatiaCuracaoCyprusCzech RepublicDenmarkDjiboutiDominicaDominican RepublicEarly-demographic dividendEast Asia & PacificEast Asia & Pacific (excluding high income)East Asia & Pacific (IDA & IBRD countries)EcuadorEgypt, Arab Rep.El SalvadorEquatorial GuineaEritreaEstoniaEthiopiaEuro areaEurope & Central AsiaEurope & Central Asia (excluding high income)Europe & Central Asia (IDA & IBRD countries)European UnionFaroe IslandsFijiFinlandFragile and conflict affected situationsFranceFrench PolynesiaGabonGambia, TheGeorgiaGermanyGhanaGreeceGrenadaGuatemalaGuineaGuinea-BissauGuyanaHaitiHeavily indebted poor countries (HIPC)High incomeHondurasHong Kong SAR, ChinaHungaryIBRD onlyIcelandIDA & IBRD totalIDA onlyIDA totalIndiaIndonesiaIran, Islamic Rep.IraqIrelandIsraelItalyJamaicaJapanJordanKazakhstanKenyaKiribatiKorea, Rep.KosovoKuwaitKyrgyz RepublicLao PDRLate-demographic dividendLatin America & Caribbean Latin America & Caribbean (excluding high income)Latin America & the Caribbean (IDA & IBRD countries)LatviaLeast developed countries: UN classificationLebanonLesothoLiberiaLibyaLithuaniaLow & middle incomeLow incomeLower middle incomeLuxembourgMacao SAR, ChinaMacedonia, FYRMadagascarMalawiMalaysiaMaldivesMaliMaltaMarshall IslandsMauritaniaMauritiusMexicoMicronesia, Fed. Sts.Middle East & North AfricaMiddle East & North Africa (excluding high income)Middle East & North Africa (IDA & IBRD countries)Middle incomeMoldovaMongoliaMontenegroMoroccoMozambiqueMyanmarNamibiaNepalNetherlandsNew CaledoniaNew ZealandNicaraguaNigerNigeriaNorth AmericaNorwayOECD membersOmanOther small statesPacific island small statesPakistanPalauPanamaPapua New GuineaParaguayPeruPhilippinesPolandPortugalPost-demographic dividendPre-demographic dividendQatarRomaniaRussian FederationRwandaSamoaSao Tome and PrincipeSaudi ArabiaSenegalSerbiaSeychellesSierra LeoneSingaporeSint Maarten (Dutch part)Slovak RepublicSloveniaSmall statesSolomon IslandsSouth AfricaSouth AsiaSouth Asia (IDA & IBRD)South SudanSpainSri LankaSt. Kitts and NevisSt. LuciaSt. Vincent and the GrenadinesSub-Saharan Africa Sub-Saharan Africa (excluding high income)Sub-Saharan Africa (IDA & IBRD countries)SudanSurinameSwazilandSwedenSwitzerlandSyrian Arab RepublicTajikistanTanzaniaThailandTimor-LesteTogoTongaTrinidad and TobagoTunisiaTurkeyTuvaluUgandaUkraineUnited KingdomUnited StatesUpper middle incomeUruguayVanuatuVenezuela, RBWest Bank and GazaWorldYemen, Rep.ZambiaZimbabwe Linha do tempo:
Nesta escala de tempo está apresentado um gráfico de 1979 ano até 2016 ano Sub-Saharan Africa (IDA & IBRD countries). Dados de 1978 ano ausente. O número de observações reais por data: 37.
Fonte (nome):
Indicadores de desenvolvimento mundial
Fonte (organização):
International Monetary Fund, Balance of Payments Statistics Yearbook and data files.
Categorias:
Economy & Growth, Trade
Foi atualizado:
23 abr 2017 ano
Indicadores de alterações dos valores ao longo dos anos
Mínimo:
22.602
1 jan 2006 ano
Máximo:
36.008
1 jan 2003 ano
Na data de observação
Valor
Mudança absoluta
A alteração em relação ao valor anterior
1 jan 1979 ano
26.433
+26.433
0.0%
1 jan 1980 ano
23.661
-2.772
-10.49%
1 jan 1981 ano
24.348
+0.687
2.9%
1 jan 1982 ano
29.645
+5.297
21.75%
1 jan 1983 ano
28.318
-1.327
-4.48%
1 jan 1984 ano
27.617
-0.7
-2.47%
1 jan 1985 ano
27.999
+0.382
1.38%
1 jan 1986 ano
33.92
+5.92
21.14%
1 jan 1988 ano
30.849
-3.071
-9.05%
1 jan 1989 ano
30.423
-0.426
-1.38%
1 jan 1990 ano
35.678
+5.255
17.27%
1 jan 1991 ano
35.929
+0.251
0.7%
1 jan 1992 ano
34.634
-1.294
-3.6%
1 jan 1993 ano
35.856
+1.222
3.53%
1 jan 1994 ano
35.113
-0.742
-2.07%
1 jan 1995 ano
30.093
-5.021
-14.3%
1 jan 1996 ano
30.333
+0.24
0.8%
1 jan 1997 ano
29.976
-0.357
-1.18%
1 jan 1998 ano
29.1
-0.876
-2.92%
1 jan 1999 ano
28.674
-0.426
-1.46%
1 jan 2000 ano
29.458
+0.784
2.73%
1 jan 2001 ano
34.493
+5.035
17.09%
1 jan 2002 ano
33.482
-1.011
-2.93%
1 jan 2003 ano
36.008
+2.526
7.54%
1 jan 2004 ano
30.858
-5.15
-14.3%
1 jan 2005 ano
29.857
-1.001
-3.24%
1 jan 2006 ano
22.602
-7.255
-24.3%
1 jan 2007 ano
25.624
+3.022
13.37%
1 jan 2008 ano
24.718
-0.906
-3.53%
1 jan 2009 ano
27.038
+2.32
9.38%
1 jan 2010 ano
27.086
+0.049
0.18%
1 jan 2011 ano
25.385
-1.701
-6.28%
1 jan 2012 ano
27.93
+2.545
10.03%
1 jan 2013 ano
26.688
-1.242
-4.45%
1 jan 2014 ano
27.618
+0.93
3.48%
1 jan 2015 ano
26.815
-0.803
-2.91%
1 jan 2016 ano
31.162
+4.347
16.21%
Classificação de países por estatísticas atuais por anos


Comentários: