29
/pt/
pt
AIzaSyAYiBZKx7MnpbEhh9jyipgxe19OcubqV5w
April 1, 2024
266659
Trinidad and Tobago
TTO
true
2
1
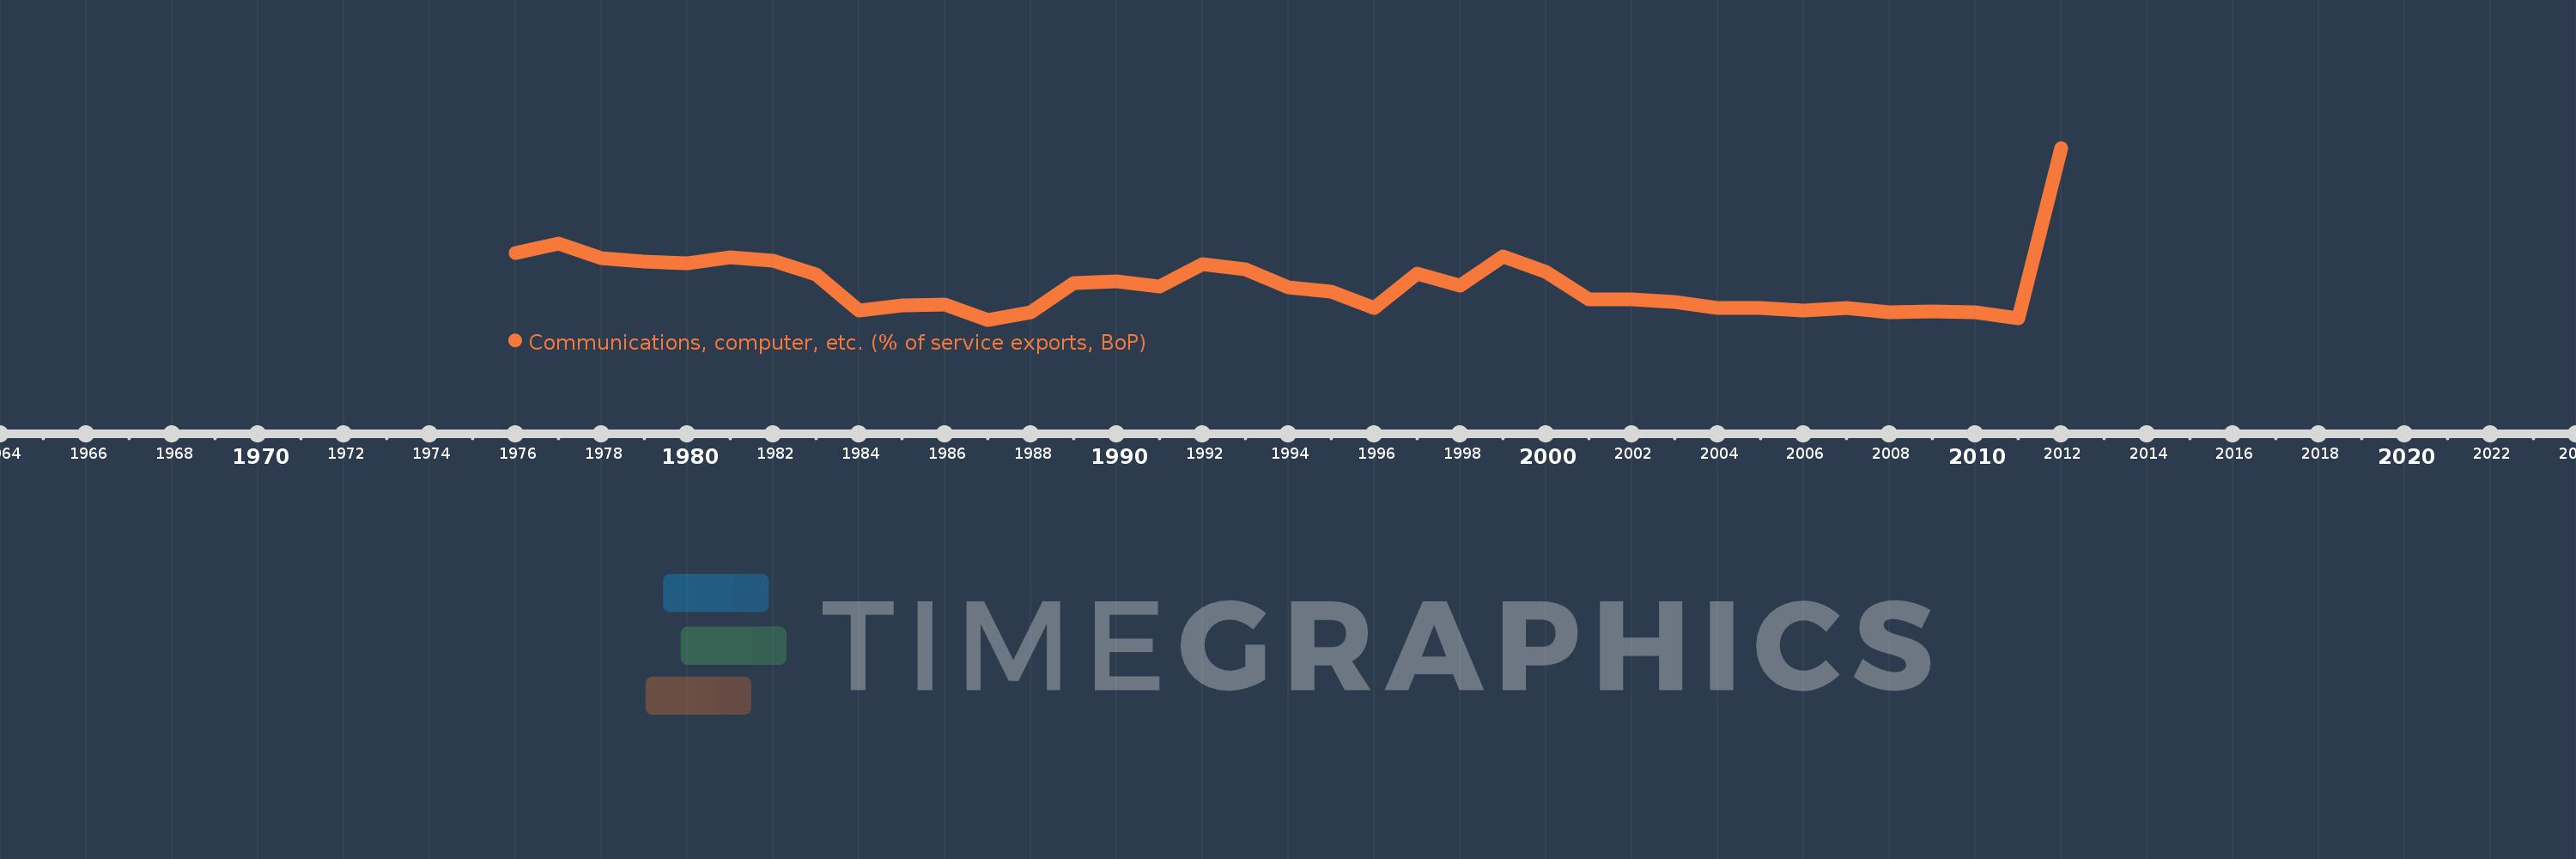
Communications, computer, etc. (% of service exports, BoP)
2012,2011,2010,2009,2008,2007,2006,2005,2004,2003,2002,2001,2000,1999,1998,1997,1996,1995,1994,1993,1992,1991,1990,1989,1988,1987,1986,1985,1984,1983,1982,1981,1980,1979,1978,1977,1976
Estas estatísticas em outros países:
AfghanistanAlbaniaAlgeriaAngolaAntigua and BarbudaArab WorldArgentinaArmeniaArubaAustraliaAustriaAzerbaijanBahamas, TheBahrainBangladeshBarbadosBelarusBelgiumBelizeBeninBermudaBhutanBoliviaBosnia and HerzegovinaBotswanaBrazilBrunei DarussalamBulgariaBurkina FasoBurundiCabo VerdeCambodiaCameroonCanadaCaribbean small statesCentral African RepublicCentral Europe and the BalticsChadChileChinaColombiaComorosCongo, Dem. Rep.Congo, Rep.Costa RicaCote d'IvoireCroatiaCuracaoCyprusCzech RepublicDenmarkDjiboutiDominicaDominican RepublicEarly-demographic dividendEast Asia & PacificEast Asia & Pacific (excluding high income)East Asia & Pacific (IDA & IBRD countries)EcuadorEgypt, Arab Rep.El SalvadorEquatorial GuineaEritreaEstoniaEthiopiaEuro areaEurope & Central AsiaEurope & Central Asia (excluding high income)Europe & Central Asia (IDA & IBRD countries)European UnionFaroe IslandsFijiFinlandFragile and conflict affected situationsFranceFrench PolynesiaGabonGambia, TheGeorgiaGermanyGhanaGreeceGrenadaGuatemalaGuineaGuinea-BissauGuyanaHaitiHeavily indebted poor countries (HIPC)High incomeHondurasHong Kong SAR, ChinaHungaryIBRD onlyIcelandIDA & IBRD totalIDA onlyIDA totalIndiaIndonesiaIran, Islamic Rep.IraqIrelandIsraelItalyJamaicaJapanJordanKazakhstanKenyaKiribatiKorea, Rep.KosovoKuwaitKyrgyz RepublicLao PDRLate-demographic dividendLatin America & Caribbean Latin America & Caribbean (excluding high income)Latin America & the Caribbean (IDA & IBRD countries)LatviaLeast developed countries: UN classificationLebanonLesothoLiberiaLibyaLithuaniaLow & middle incomeLow incomeLower middle incomeLuxembourgMacao SAR, ChinaMacedonia, FYRMadagascarMalawiMalaysiaMaldivesMaliMaltaMarshall IslandsMauritaniaMauritiusMexicoMicronesia, Fed. Sts.Middle East & North AfricaMiddle East & North Africa (excluding high income)Middle East & North Africa (IDA & IBRD countries)Middle incomeMoldovaMongoliaMontenegroMoroccoMozambiqueMyanmarNamibiaNepalNetherlandsNew CaledoniaNew ZealandNicaraguaNigerNigeriaNorth AmericaNorwayOECD membersOmanOther small statesPacific island small statesPakistanPalauPanamaPapua New GuineaParaguayPeruPhilippinesPolandPortugalPost-demographic dividendPre-demographic dividendQatarRomaniaRussian FederationRwandaSamoaSao Tome and PrincipeSaudi ArabiaSenegalSerbiaSeychellesSierra LeoneSingaporeSint Maarten (Dutch part)Slovak RepublicSloveniaSmall statesSolomon IslandsSouth AfricaSouth AsiaSouth Asia (IDA & IBRD)South SudanSpainSri LankaSt. Kitts and NevisSt. LuciaSt. Vincent and the GrenadinesSub-Saharan Africa Sub-Saharan Africa (excluding high income)Sub-Saharan Africa (IDA & IBRD countries)SudanSurinameSwazilandSwedenSwitzerlandSyrian Arab RepublicTajikistanTanzaniaThailandTimor-LesteTogoTongaTrinidad and TobagoTunisiaTurkeyTuvaluUgandaUkraineUnited KingdomUnited StatesUpper middle incomeUruguayVanuatuVenezuela, RBWest Bank and GazaWorldYemen, Rep.ZambiaZimbabwe Linha do tempo:
Nesta escala de tempo está apresentado um gráfico de 1976 ano até 2012 ano Trinidad and Tobago. Dados de 1975 ano ausente. O número de observações reais por data: 37.
Fonte (nome):
Indicadores de desenvolvimento mundial
Fonte (organização):
International Monetary Fund, Balance of Payments Statistics Yearbook and data files.
Categorias:
Economy & Growth, Trade
Foi atualizado:
23 abr 2017 ano
Indicadores de alterações dos valores ao longo dos anos
Mínimo:
6.39
1 jan 1987 ano
Máximo:
85.41
1 jan 2012 ano
Na data de observação
Valor
Mudança absoluta
A alteração em relação ao valor anterior
1 jan 1976 ano
37.002
+37.002
0.0%
1 jan 1977 ano
41.484
+4.482
12.11%
1 jan 1978 ano
34.86
-6.623
-15.97%
1 jan 1979 ano
33.27
-1.59
-4.56%
1 jan 1980 ano
32.199
-1.071
-3.22%
1 jan 1981 ano
35.028
+2.829
8.79%
1 jan 1982 ano
33.337
-1.691
-4.83%
1 jan 1983 ano
27.064
-6.273
-18.82%
1 jan 1984 ano
10.6
-16.464
-60.83%
1 jan 1985 ano
12.922
+2.322
21.91%
1 jan 1986 ano
13.555
+0.632
4.89%
1 jan 1987 ano
6.39
-7.165
-52.86%
1 jan 1988 ano
9.899
+3.509
54.92%
1 jan 1989 ano
23.43
+13.53
136.68%
1 jan 1990 ano
23.978
+0.548
2.34%
1 jan 1991 ano
21.528
-2.45
-10.22%
1 jan 1992 ano
32.07
+10.541
48.96%
1 jan 1993 ano
29.64
-2.43
-7.58%
1 jan 1994 ano
21.202
-8.437
-28.47%
1 jan 1995 ano
19.498
-1.705
-8.04%
1 jan 1996 ano
11.955
-7.542
-38.68%
1 jan 1997 ano
27.464
+15.509
129.72%
1 jan 1998 ano
21.954
-5.511
-20.06%
1 jan 1999 ano
35.58
+13.626
62.07%
1 jan 2000 ano
28.263
-7.317
-20.56%
1 jan 2001 ano
15.818
-12.445
-44.03%
1 jan 2002 ano
15.676
-0.142
-0.89%
1 jan 2003 ano
14.646
-1.03
-6.57%
1 jan 2004 ano
11.909
-2.737
-18.69%
1 jan 2005 ano
11.918
+0.009
0.08%
1 jan 2006 ano
10.425
-1.493
-12.53%
1 jan 2007 ano
11.905
+1.48
14.2%
1 jan 2008 ano
9.894
-2.011
-16.89%
1 jan 2009 ano
10.294
+0.4
4.04%
1 jan 2010 ano
9.806
-0.487
-4.73%
1 jan 2011 ano
7.092
-2.714
-27.68%
1 jan 2012 ano
85.41
+78.318
1.1 mil%
Classificação de países por estatísticas atuais por anos


Comentários: