29
/pt/
pt
AIzaSyAYiBZKx7MnpbEhh9jyipgxe19OcubqV5w
April 1, 2024
265578
Tonga
TON
true
2
1
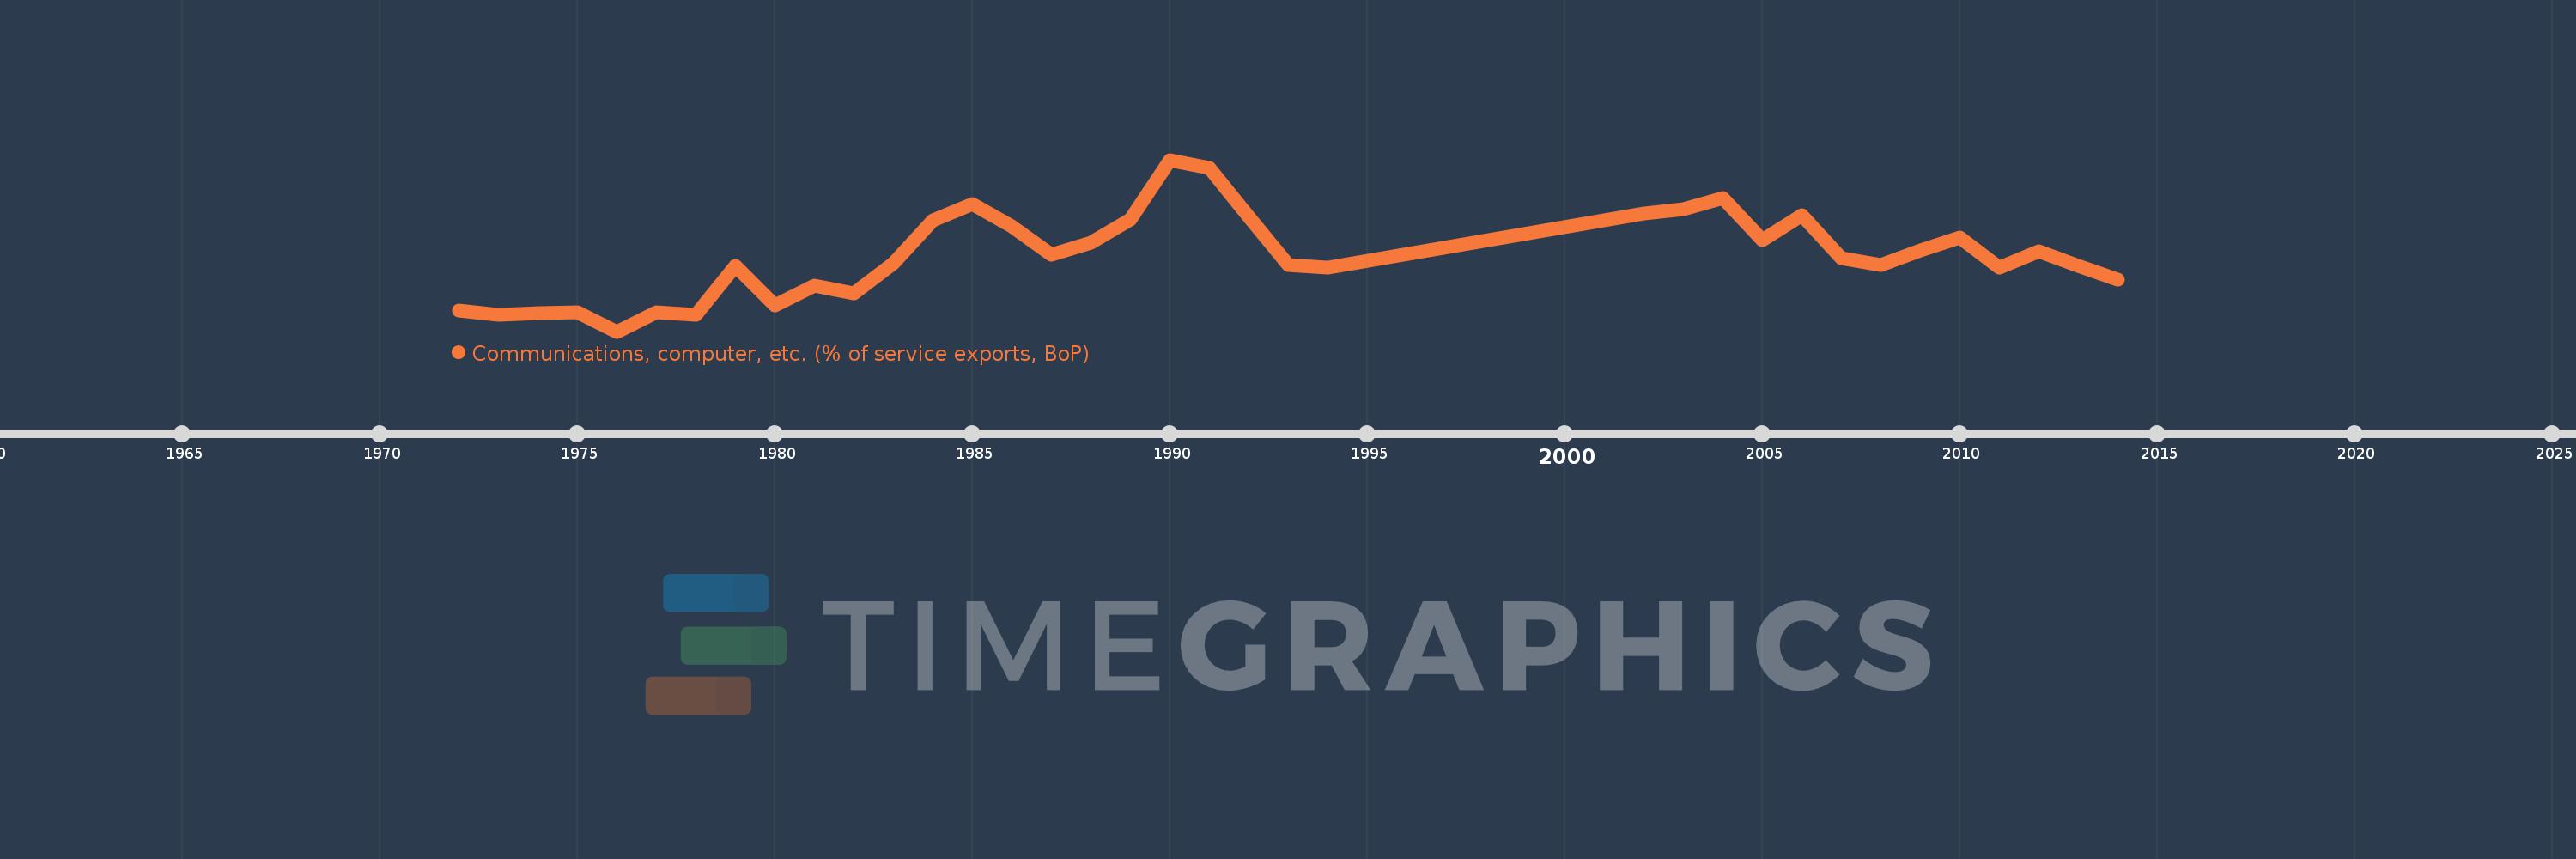
Communications, computer, etc. (% of service exports, BoP)
2014,2013,2012,2011,2010,2009,2008,2007,2006,2005,2004,2003,2002,1994,1993,1992,1991,1990,1989,1988,1987,1986,1985,1984,1983,1982,1981,1980,1979,1978,1977,1976,1975,1974,1973,1972
Estas estatísticas em outros países:
AfghanistanAlbaniaAlgeriaAngolaAntigua and BarbudaArab WorldArgentinaArmeniaArubaAustraliaAustriaAzerbaijanBahamas, TheBahrainBangladeshBarbadosBelarusBelgiumBelizeBeninBermudaBhutanBoliviaBosnia and HerzegovinaBotswanaBrazilBrunei DarussalamBulgariaBurkina FasoBurundiCabo VerdeCambodiaCameroonCanadaCaribbean small statesCentral African RepublicCentral Europe and the BalticsChadChileChinaColombiaComorosCongo, Dem. Rep.Congo, Rep.Costa RicaCote d'IvoireCroatiaCuracaoCyprusCzech RepublicDenmarkDjiboutiDominicaDominican RepublicEarly-demographic dividendEast Asia & PacificEast Asia & Pacific (excluding high income)East Asia & Pacific (IDA & IBRD countries)EcuadorEgypt, Arab Rep.El SalvadorEquatorial GuineaEritreaEstoniaEthiopiaEuro areaEurope & Central AsiaEurope & Central Asia (excluding high income)Europe & Central Asia (IDA & IBRD countries)European UnionFaroe IslandsFijiFinlandFragile and conflict affected situationsFranceFrench PolynesiaGabonGambia, TheGeorgiaGermanyGhanaGreeceGrenadaGuatemalaGuineaGuinea-BissauGuyanaHaitiHeavily indebted poor countries (HIPC)High incomeHondurasHong Kong SAR, ChinaHungaryIBRD onlyIcelandIDA & IBRD totalIDA onlyIDA totalIndiaIndonesiaIran, Islamic Rep.IraqIrelandIsraelItalyJamaicaJapanJordanKazakhstanKenyaKiribatiKorea, Rep.KosovoKuwaitKyrgyz RepublicLao PDRLate-demographic dividendLatin America & Caribbean Latin America & Caribbean (excluding high income)Latin America & the Caribbean (IDA & IBRD countries)LatviaLeast developed countries: UN classificationLebanonLesothoLiberiaLibyaLithuaniaLow & middle incomeLow incomeLower middle incomeLuxembourgMacao SAR, ChinaMacedonia, FYRMadagascarMalawiMalaysiaMaldivesMaliMaltaMarshall IslandsMauritaniaMauritiusMexicoMicronesia, Fed. Sts.Middle East & North AfricaMiddle East & North Africa (excluding high income)Middle East & North Africa (IDA & IBRD countries)Middle incomeMoldovaMongoliaMontenegroMoroccoMozambiqueMyanmarNamibiaNepalNetherlandsNew CaledoniaNew ZealandNicaraguaNigerNigeriaNorth AmericaNorwayOECD membersOmanOther small statesPacific island small statesPakistanPalauPanamaPapua New GuineaParaguayPeruPhilippinesPolandPortugalPost-demographic dividendPre-demographic dividendQatarRomaniaRussian FederationRwandaSamoaSao Tome and PrincipeSaudi ArabiaSenegalSerbiaSeychellesSierra LeoneSingaporeSint Maarten (Dutch part)Slovak RepublicSloveniaSmall statesSolomon IslandsSouth AfricaSouth AsiaSouth Asia (IDA & IBRD)South SudanSpainSri LankaSt. Kitts and NevisSt. LuciaSt. Vincent and the GrenadinesSub-Saharan Africa Sub-Saharan Africa (excluding high income)Sub-Saharan Africa (IDA & IBRD countries)SudanSurinameSwazilandSwedenSwitzerlandSyrian Arab RepublicTajikistanTanzaniaThailandTimor-LesteTogoTongaTrinidad and TobagoTunisiaTurkeyTuvaluUgandaUkraineUnited KingdomUnited StatesUpper middle incomeUruguayVanuatuVenezuela, RBWest Bank and GazaWorldYemen, Rep.ZambiaZimbabwe Linha do tempo:
Nesta escala de tempo está apresentado um gráfico de 1972 ano até 2014 ano Tonga. Dados de 1971 ano ausente. O número de observações reais por data: 36.
Fonte (nome):
Indicadores de desenvolvimento mundial
Fonte (organização):
International Monetary Fund, Balance of Payments Statistics Yearbook and data files.
Categorias:
Economy & Growth, Trade
Foi atualizado:
23 abr 2017 ano
Indicadores de alterações dos valores ao longo dos anos
Mínimo:
0.344
1 jan 1976 ano
Máximo:
64.245
1 jan 1990 ano
Na data de observação
Valor
Mudança absoluta
A alteração em relação ao valor anterior
1 jan 1972 ano
8.213
+8.213
0.0%
1 jan 1973 ano
6.441
-1.772
-21.58%
1 jan 1974 ano
7.354
+0.913
14.18%
1 jan 1975 ano
7.517
+0.163
2.21%
1 jan 1976 ano
0.344
-7.172
-95.42%
1 jan 1977 ano
7.499
+7.154
2.08 mil%
1 jan 1978 ano
6.55
-0.949
-12.66%
1 jan 1979 ano
24.904
+18.355
280.24%
1 jan 1980 ano
10.092
-14.812
-59.48%
1 jan 1981 ano
17.317
+7.225
71.59%
1 jan 1982 ano
14.491
-2.826
-16.32%
1 jan 1983 ano
25.711
+11.221
77.43%
1 jan 1984 ano
41.76
+16.049
62.42%
1 jan 1985 ano
47.904
+6.144
14.71%
1 jan 1986 ano
39.329
-8.575
-17.9%
1 jan 1987 ano
28.869
-10.46
-26.6%
1 jan 1988 ano
33.382
+4.514
15.63%
1 jan 1989 ano
42.073
+8.691
26.03%
1 jan 1990 ano
64.245
+22.172
52.7%
1 jan 1991 ano
61.052
-3.193
-4.97%
1 jan 1992 ano
43.017
-18.035
-29.54%
1 jan 1993 ano
25.261
-17.756
-41.28%
1 jan 1994 ano
24.038
-1.223
-4.84%
1 jan 2002 ano
44.311
+20.272
84.34%
1 jan 2003 ano
45.873
+1.563
3.53%
1 jan 2004 ano
50.114
+4.241
9.24%
1 jan 2005 ano
34.489
-15.626
-31.18%
1 jan 2006 ano
43.762
+9.273
26.89%
1 jan 2007 ano
27.609
-16.153
-36.91%
1 jan 2008 ano
25.122
-2.487
-9.01%
1 jan 2009 ano
30.637
+5.515
21.95%
1 jan 2010 ano
35.485
+4.848
15.82%
1 jan 2011 ano
24.266
-11.219
-31.62%
1 jan 2012 ano
30.175
+5.909
24.35%
1 jan 2013 ano
24.869
-5.306
-17.59%
1 jan 2014 ano
19.729
-5.139
-20.67%
Classificação de países por estatísticas atuais por anos


Comentários: