29
/pt/
pt
AIzaSyAYiBZKx7MnpbEhh9jyipgxe19OcubqV5w
April 1, 2024
60526
Sub-Saharan Africa (IDA & IBRD countries)
TSS
false
2
1
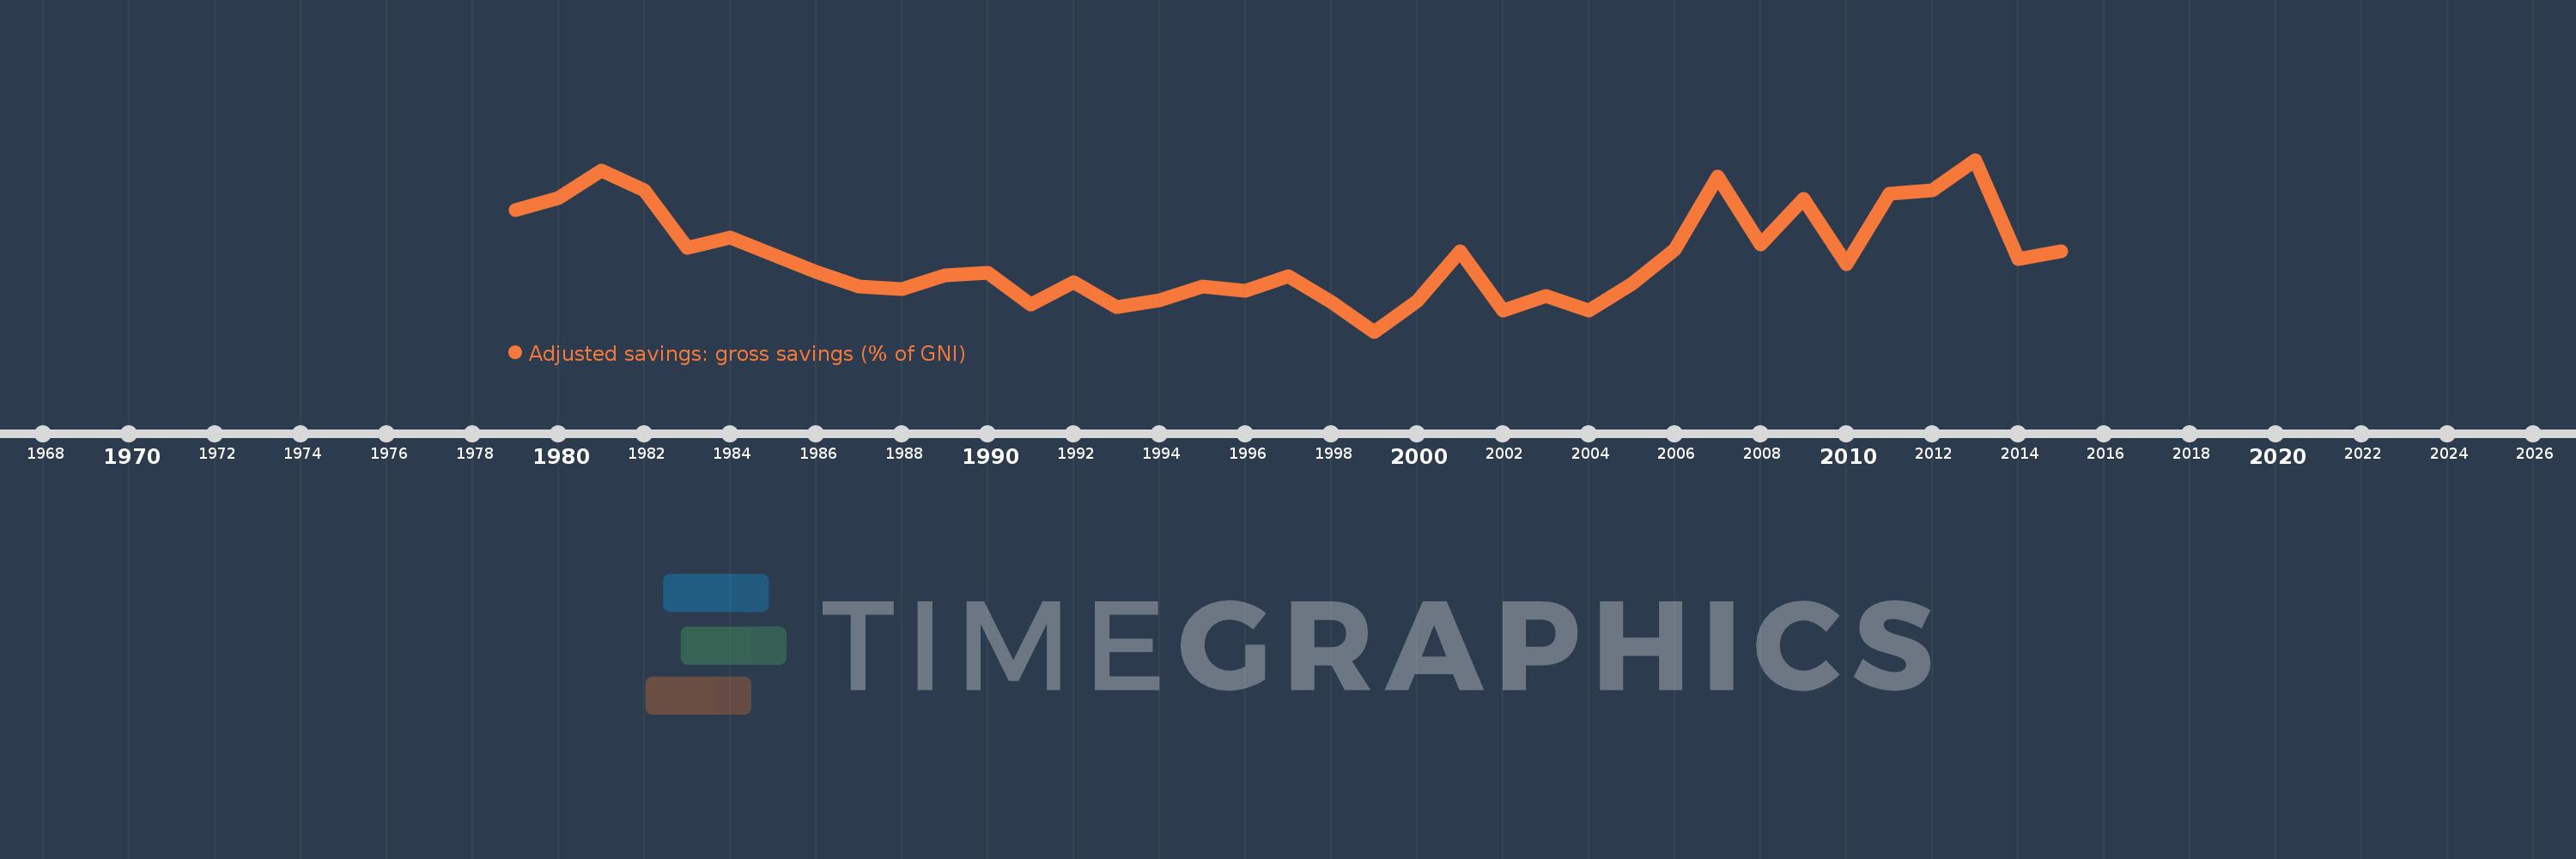
Adjusted savings: gross savings (% of GNI)
2015,2014,2013,2012,2011,2010,2009,2008,2007,2006,2005,2004,2003,2002,2001,2000,1999,1998,1997,1996,1995,1994,1993,1992,1991,1990,1989,1988,1987,1986,1985,1984,1983,1982,1981,1980,1979
Estas estatísticas em outros países:
AfghanistanAlbaniaAlgeriaAngolaAntigua and BarbudaArab WorldArgentinaArmeniaAustraliaAustriaAzerbaijanBahamas, TheBahrainBangladeshBarbadosBelarusBelgiumBelizeBeninBermudaBhutanBoliviaBosnia and HerzegovinaBotswanaBrazilBrunei DarussalamBulgariaBurkina FasoBurundiCabo VerdeCambodiaCameroonCanadaCaribbean small statesCentral African RepublicCentral Europe and the BalticsChadChileChinaColombiaComorosCongo, Dem. Rep.Congo, Rep.Costa RicaCote d'IvoireCroatiaCyprusCzech RepublicDenmarkDjiboutiDominicaDominican RepublicEarly-demographic dividendEast Asia & PacificEast Asia & Pacific (excluding high income)East Asia & Pacific (IDA & IBRD countries)EcuadorEgypt, Arab Rep.El SalvadorEquatorial GuineaEritreaEstoniaEthiopiaEuro areaEurope & Central AsiaEurope & Central Asia (excluding high income)Europe & Central Asia (IDA & IBRD countries)European UnionFaroe IslandsFijiFinlandFragile and conflict affected situationsFranceGabonGambia, TheGeorgiaGermanyGhanaGreeceGrenadaGuatemalaGuineaGuinea-BissauGuyanaHaitiHeavily indebted poor countries (HIPC)High incomeHondurasHong Kong SAR, ChinaHungaryIBRD onlyIcelandIDA & IBRD totalIDA blendIDA onlyIDA totalIndiaIndonesiaIran, Islamic Rep.IraqIrelandIsraelItalyJamaicaJapanJordanKazakhstanKenyaKiribatiKorea, Rep.KosovoKuwaitKyrgyz RepublicLao PDRLate-demographic dividendLatin America & Caribbean Latin America & Caribbean (excluding high income)Latin America & the Caribbean (IDA & IBRD countries)LatviaLeast developed countries: UN classificationLebanonLesothoLiberiaLibyaLithuaniaLow & middle incomeLow incomeLower middle incomeLuxembourgMacao SAR, ChinaMacedonia, FYRMadagascarMalawiMalaysiaMaldivesMaliMaltaMauritaniaMauritiusMexicoMiddle East & North AfricaMiddle East & North Africa (excluding high income)Middle East & North Africa (IDA & IBRD countries)Middle incomeMoldovaMongoliaMontenegroMoroccoMozambiqueNamibiaNepalNetherlandsNew ZealandNicaraguaNigerNigeriaNorth AmericaNorwayOECD membersOmanOther small statesPacific island small statesPakistanPanamaPapua New GuineaParaguayPeruPhilippinesPolandPortugalPost-demographic dividendPre-demographic dividendQatarRomaniaRussian FederationRwandaSaudi ArabiaSenegalSerbiaSeychellesSierra LeoneSingaporeSlovak RepublicSloveniaSmall statesSolomon IslandsSouth AfricaSouth AsiaSouth Asia (IDA & IBRD)SpainSri LankaSt. Kitts and NevisSt. LuciaSt. Vincent and the GrenadinesSub-Saharan Africa Sub-Saharan Africa (excluding high income)Sub-Saharan Africa (IDA & IBRD countries)SudanSurinameSwazilandSwedenSwitzerlandSyrian Arab RepublicTajikistanTanzaniaThailandTimor-LesteTogoTongaTrinidad and TobagoTunisiaTurkeyTurkmenistanUgandaUkraineUnited KingdomUnited StatesUpper middle incomeUruguayVanuatuVenezuela, RBVietnamWest Bank and GazaWorldYemen, Rep.ZambiaZimbabwe Linha do tempo:
Nesta escala de tempo está apresentado um gráfico de 1979 ano até 2015 ano Sub-Saharan Africa (IDA & IBRD countries). Dados de 1978 ano ausente. O número de observações reais por data: 37.
Fonte (nome):
Indicadores de desenvolvimento mundial
Fonte (organização):
World Bank national accounts data files.
Categorias:
Economy & Growth, Environment
Foi atualizado:
23 abr 2017 ano
Indicadores de alterações dos valores ao longo dos anos
Mínimo:
14.007
1 jan 1999 ano
Máximo:
24.205
1 jan 2013 ano
Na data de observação
Valor
Mudança absoluta
A alteração em relação ao valor anterior
1 jan 1979 ano
21.219
+21.219
0.0%
1 jan 1980 ano
21.934
+0.714
3.37%
1 jan 1981 ano
23.589
+1.655
7.55%
1 jan 1982 ano
22.375
-1.214
-5.15%
1 jan 1983 ano
18.976
-3.399
-15.19%
1 jan 1984 ano
19.602
+0.626
3.3%
1 jan 1985 ano
18.55
-1.052
-5.37%
1 jan 1986 ano
17.556
-0.994
-5.36%
1 jan 1987 ano
16.696
-0.86
-4.9%
1 jan 1988 ano
16.518
-0.178
-1.07%
1 jan 1989 ano
17.368
+0.85
5.15%
1 jan 1990 ano
17.509
+0.141
0.81%
1 jan 1991 ano
15.592
-1.917
-10.95%
1 jan 1992 ano
16.917
+1.325
8.5%
1 jan 1993 ano
15.479
-1.437
-8.5%
1 jan 1994 ano
15.855
+0.376
2.43%
1 jan 1995 ano
16.671
+0.815
5.14%
1 jan 1996 ano
16.449
-0.222
-1.33%
1 jan 1997 ano
17.308
+0.859
5.22%
1 jan 1998 ano
15.761
-1.547
-8.94%
1 jan 1999 ano
14.007
-1.753
-11.12%
1 jan 2000 ano
15.805
+1.798
12.83%
1 jan 2001 ano
18.784
+2.979
18.85%
1 jan 2002 ano
15.268
-3.516
-18.72%
1 jan 2003 ano
16.124
+0.856
5.6%
1 jan 2004 ano
15.232
-0.891
-5.53%
1 jan 2005 ano
16.856
+1.624
10.66%
1 jan 2006 ano
18.854
+1.998
11.86%
1 jan 2007 ano
23.218
+4.364
23.15%
1 jan 2008 ano
19.182
-4.036
-17.38%
1 jan 2009 ano
21.887
+2.705
14.1%
1 jan 2010 ano
18.025
-3.862
-17.64%
1 jan 2011 ano
22.167
+4.142
22.98%
1 jan 2012 ano
22.386
+0.219
0.99%
1 jan 2013 ano
24.205
+1.819
8.13%
1 jan 2014 ano
18.313
-5.892
-24.34%
1 jan 2015 ano
18.795
+0.481
2.63%
Classificação de países por estatísticas atuais por anos


Comentários: