29
/pt/
pt
AIzaSyAYiBZKx7MnpbEhh9jyipgxe19OcubqV5w
April 1, 2024
223133
Philippines
PHL
true
2
1
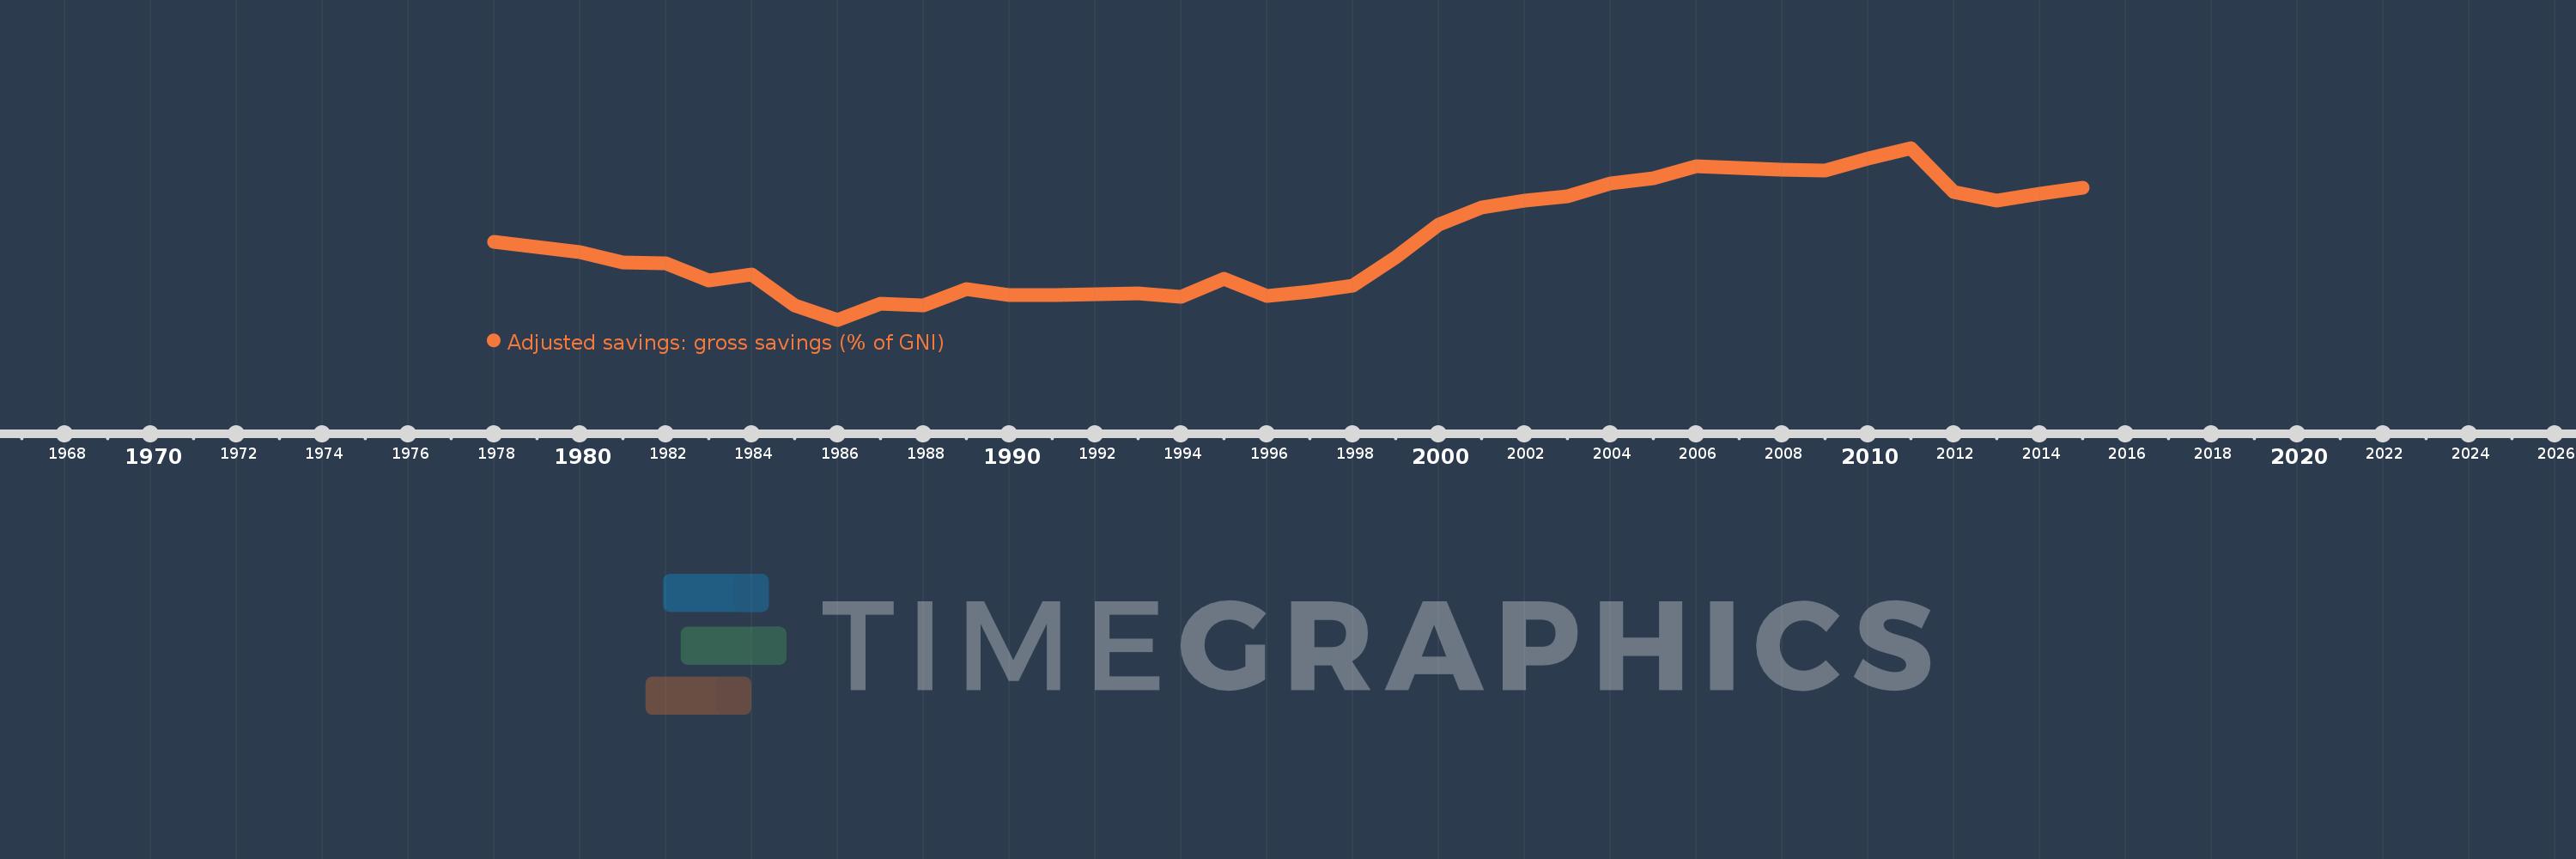
Adjusted savings: gross savings (% of GNI)
2015,2014,2013,2012,2011,2010,2009,2008,2007,2006,2005,2004,2003,2002,2001,2000,1999,1998,1997,1996,1995,1994,1993,1992,1991,1990,1989,1988,1987,1986,1985,1984,1983,1982,1981,1980,1979,1978
Estas estatísticas em outros países:
AfghanistanAlbaniaAlgeriaAngolaAntigua and BarbudaArab WorldArgentinaArmeniaAustraliaAustriaAzerbaijanBahamas, TheBahrainBangladeshBarbadosBelarusBelgiumBelizeBeninBermudaBhutanBoliviaBosnia and HerzegovinaBotswanaBrazilBrunei DarussalamBulgariaBurkina FasoBurundiCabo VerdeCambodiaCameroonCanadaCaribbean small statesCentral African RepublicCentral Europe and the BalticsChadChileChinaColombiaComorosCongo, Dem. Rep.Congo, Rep.Costa RicaCote d'IvoireCroatiaCyprusCzech RepublicDenmarkDjiboutiDominicaDominican RepublicEarly-demographic dividendEast Asia & PacificEast Asia & Pacific (excluding high income)East Asia & Pacific (IDA & IBRD countries)EcuadorEgypt, Arab Rep.El SalvadorEquatorial GuineaEritreaEstoniaEthiopiaEuro areaEurope & Central AsiaEurope & Central Asia (excluding high income)Europe & Central Asia (IDA & IBRD countries)European UnionFaroe IslandsFijiFinlandFragile and conflict affected situationsFranceGabonGambia, TheGeorgiaGermanyGhanaGreeceGrenadaGuatemalaGuineaGuinea-BissauGuyanaHaitiHeavily indebted poor countries (HIPC)High incomeHondurasHong Kong SAR, ChinaHungaryIBRD onlyIcelandIDA & IBRD totalIDA blendIDA onlyIDA totalIndiaIndonesiaIran, Islamic Rep.IraqIrelandIsraelItalyJamaicaJapanJordanKazakhstanKenyaKiribatiKorea, Rep.KosovoKuwaitKyrgyz RepublicLao PDRLate-demographic dividendLatin America & Caribbean Latin America & Caribbean (excluding high income)Latin America & the Caribbean (IDA & IBRD countries)LatviaLeast developed countries: UN classificationLebanonLesothoLiberiaLibyaLithuaniaLow & middle incomeLow incomeLower middle incomeLuxembourgMacao SAR, ChinaMacedonia, FYRMadagascarMalawiMalaysiaMaldivesMaliMaltaMauritaniaMauritiusMexicoMiddle East & North AfricaMiddle East & North Africa (excluding high income)Middle East & North Africa (IDA & IBRD countries)Middle incomeMoldovaMongoliaMontenegroMoroccoMozambiqueNamibiaNepalNetherlandsNew ZealandNicaraguaNigerNigeriaNorth AmericaNorwayOECD membersOmanOther small statesPacific island small statesPakistanPanamaPapua New GuineaParaguayPeruPhilippinesPolandPortugalPost-demographic dividendPre-demographic dividendQatarRomaniaRussian FederationRwandaSaudi ArabiaSenegalSerbiaSeychellesSierra LeoneSingaporeSlovak RepublicSloveniaSmall statesSolomon IslandsSouth AfricaSouth AsiaSouth Asia (IDA & IBRD)SpainSri LankaSt. Kitts and NevisSt. LuciaSt. Vincent and the GrenadinesSub-Saharan Africa Sub-Saharan Africa (excluding high income)Sub-Saharan Africa (IDA & IBRD countries)SudanSurinameSwazilandSwedenSwitzerlandSyrian Arab RepublicTajikistanTanzaniaThailandTimor-LesteTogoTongaTrinidad and TobagoTunisiaTurkeyTurkmenistanUgandaUkraineUnited KingdomUnited StatesUpper middle incomeUruguayVanuatuVenezuela, RBVietnamWest Bank and GazaWorldYemen, Rep.ZambiaZimbabwe Linha do tempo:
Nesta escala de tempo está apresentado um gráfico de 1978 ano até 2015 ano Philippines. Dados de 1977 ano ausente. O número de observações reais por data: 38.
Fonte (nome):
Indicadores de desenvolvimento mundial
Fonte (organização):
World Bank national accounts data files.
Categorias:
Economy & Growth, Environment
Foi atualizado:
23 abr 2017 ano
Indicadores de alterações dos valores ao longo dos anos
Mínimo:
14.014
1 jan 1986 ano
Máximo:
45.619
1 jan 2011 ano
Na data de observação
Valor
Mudança absoluta
A alteração em relação ao valor anterior
1 jan 1978 ano
28.359
+28.359
0.0%
1 jan 1979 ano
27.476
-0.883
-3.11%
1 jan 1980 ano
26.449
-1.027
-3.74%
1 jan 1981 ano
24.545
-1.904
-7.2%
1 jan 1982 ano
24.43
-0.115
-0.47%
1 jan 1983 ano
21.166
-3.264
-13.36%
1 jan 1984 ano
22.264
+1.098
5.19%
1 jan 1985 ano
16.611
-5.653
-25.39%
1 jan 1986 ano
14.014
-2.597
-15.63%
1 jan 1987 ano
16.989
+2.975
21.23%
1 jan 1988 ano
16.577
-0.412
-2.43%
1 jan 1989 ano
19.595
+3.018
18.21%
1 jan 1990 ano
18.549
-1.047
-5.34%
1 jan 1991 ano
18.628
+0.08
0.43%
1 jan 1992 ano
18.676
+0.048
0.26%
1 jan 1993 ano
18.878
+0.201
1.08%
1 jan 1994 ano
18.21
-0.668
-3.54%
1 jan 1995 ano
21.482
+3.272
17.97%
1 jan 1996 ano
18.38
-3.102
-14.44%
1 jan 1997 ano
19.143
+0.764
4.15%
1 jan 1998 ano
20.282
+1.138
5.95%
1 jan 1999 ano
25.574
+5.292
26.09%
1 jan 2000 ano
31.457
+5.884
23.01%
1 jan 2001 ano
34.595
+3.138
9.98%
1 jan 2002 ano
35.904
+1.309
3.78%
1 jan 2003 ano
36.735
+0.831
2.32%
1 jan 2004 ano
39.129
+2.394
6.52%
1 jan 2005 ano
40.017
+0.888
2.27%
1 jan 2006 ano
42.219
+2.202
5.5%
1 jan 2007 ano
41.976
-0.244
-0.58%
1 jan 2008 ano
41.652
-0.323
-0.77%
1 jan 2009 ano
41.442
-0.211
-0.51%
1 jan 2010 ano
43.724
+2.282
5.51%
1 jan 2011 ano
45.619
+1.895
4.33%
1 jan 2012 ano
37.484
-8.135
-17.83%
1 jan 2013 ano
35.889
-1.595
-4.25%
1 jan 2014 ano
37.22
+1.331
3.71%
1 jan 2015 ano
38.227
+1.007
2.71%
Classificação de países por estatísticas atuais por anos


Comentários: