29
/pt/
pt
AIzaSyAYiBZKx7MnpbEhh9jyipgxe19OcubqV5w
April 1, 2024
35506
High income
HIC
false
2
1
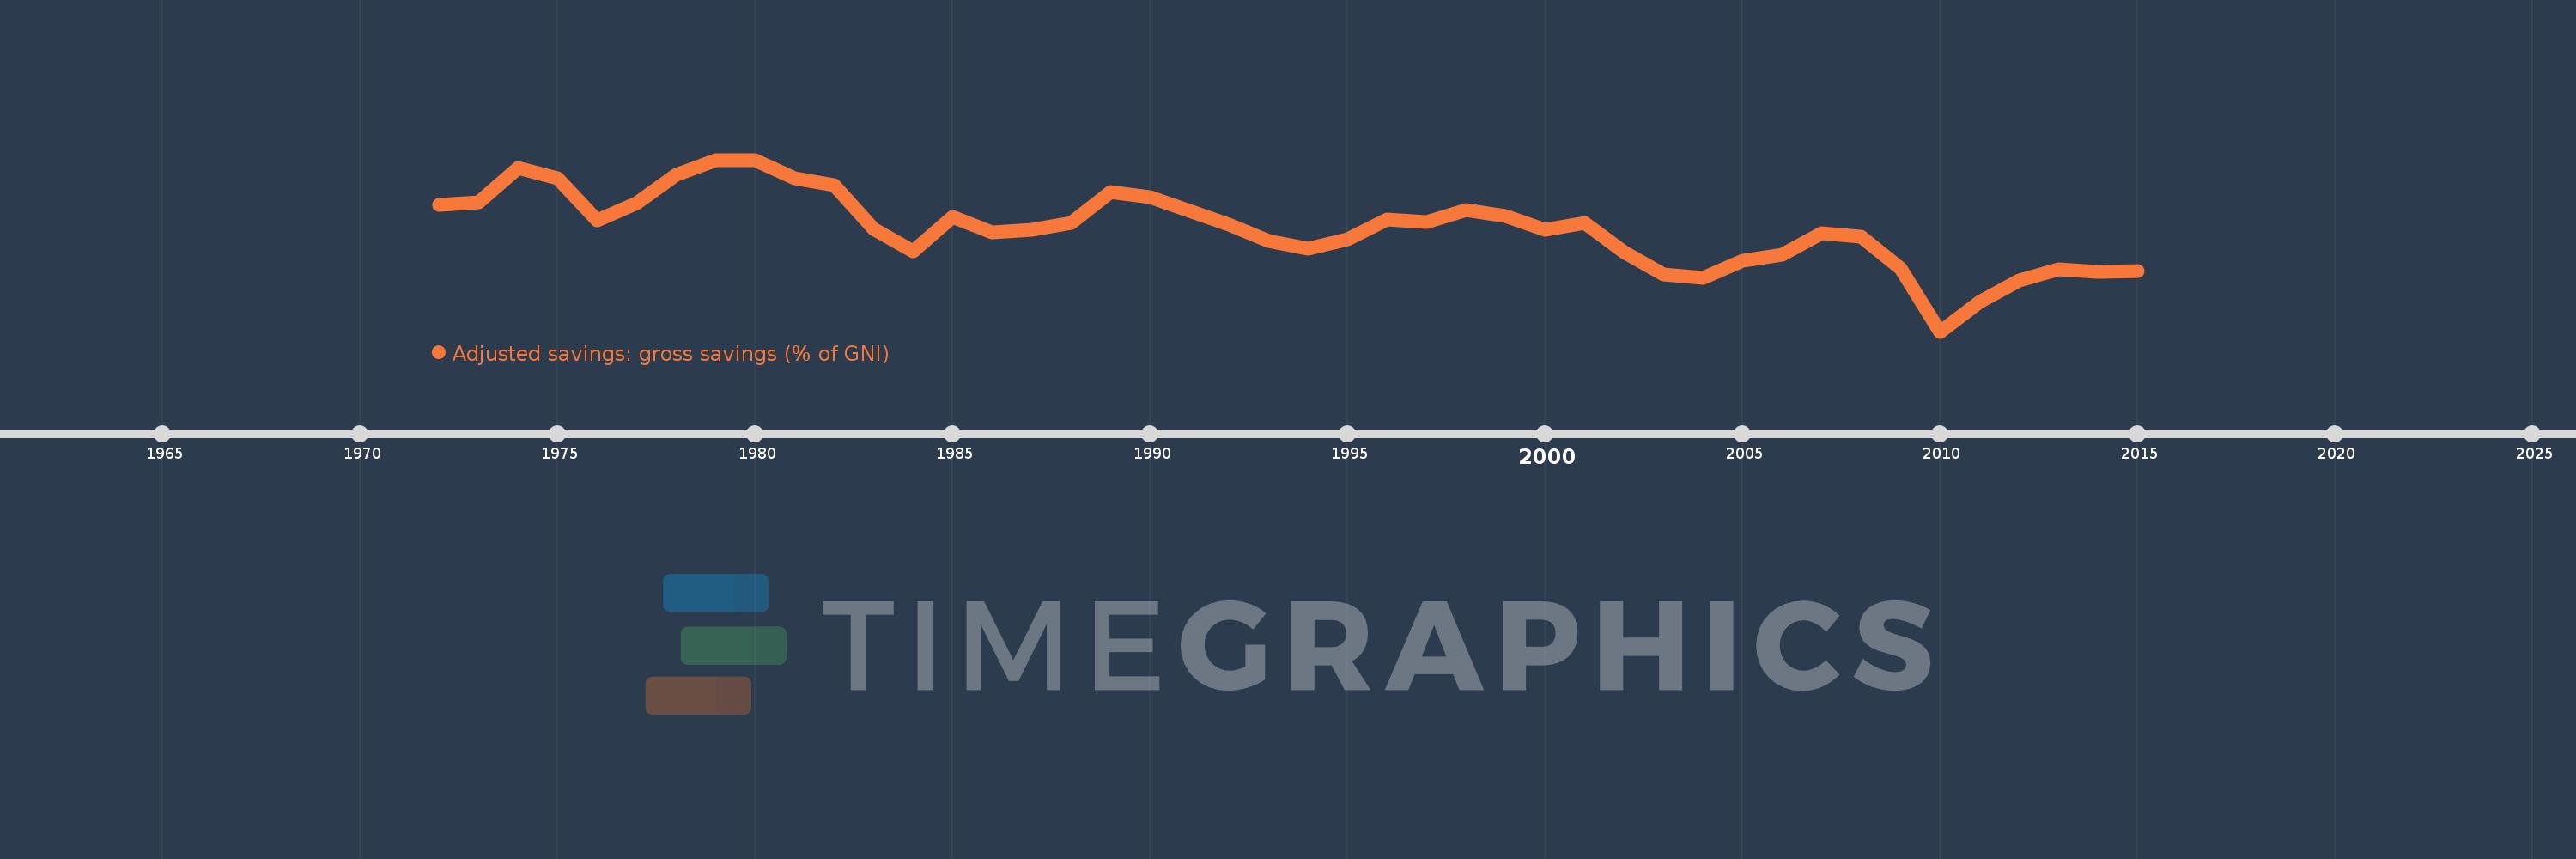
Adjusted savings: gross savings (% of GNI)
2015,2014,2013,2012,2011,2010,2009,2008,2007,2006,2005,2004,2003,2002,2001,2000,1999,1998,1997,1996,1995,1994,1993,1992,1991,1990,1989,1988,1987,1986,1985,1984,1983,1982,1981,1980,1979,1978,1977,1976,1975,1974,1973,1972
Estas estatísticas em outros países:
AfghanistanAlbaniaAlgeriaAngolaAntigua and BarbudaArab WorldArgentinaArmeniaAustraliaAustriaAzerbaijanBahamas, TheBahrainBangladeshBarbadosBelarusBelgiumBelizeBeninBermudaBhutanBoliviaBosnia and HerzegovinaBotswanaBrazilBrunei DarussalamBulgariaBurkina FasoBurundiCabo VerdeCambodiaCameroonCanadaCaribbean small statesCentral African RepublicCentral Europe and the BalticsChadChileChinaColombiaComorosCongo, Dem. Rep.Congo, Rep.Costa RicaCote d'IvoireCroatiaCyprusCzech RepublicDenmarkDjiboutiDominicaDominican RepublicEarly-demographic dividendEast Asia & PacificEast Asia & Pacific (excluding high income)East Asia & Pacific (IDA & IBRD countries)EcuadorEgypt, Arab Rep.El SalvadorEquatorial GuineaEritreaEstoniaEthiopiaEuro areaEurope & Central AsiaEurope & Central Asia (excluding high income)Europe & Central Asia (IDA & IBRD countries)European UnionFaroe IslandsFijiFinlandFragile and conflict affected situationsFranceGabonGambia, TheGeorgiaGermanyGhanaGreeceGrenadaGuatemalaGuineaGuinea-BissauGuyanaHaitiHeavily indebted poor countries (HIPC)High incomeHondurasHong Kong SAR, ChinaHungaryIBRD onlyIcelandIDA & IBRD totalIDA blendIDA onlyIDA totalIndiaIndonesiaIran, Islamic Rep.IraqIrelandIsraelItalyJamaicaJapanJordanKazakhstanKenyaKiribatiKorea, Rep.KosovoKuwaitKyrgyz RepublicLao PDRLate-demographic dividendLatin America & Caribbean Latin America & Caribbean (excluding high income)Latin America & the Caribbean (IDA & IBRD countries)LatviaLeast developed countries: UN classificationLebanonLesothoLiberiaLibyaLithuaniaLow & middle incomeLow incomeLower middle incomeLuxembourgMacao SAR, ChinaMacedonia, FYRMadagascarMalawiMalaysiaMaldivesMaliMaltaMauritaniaMauritiusMexicoMiddle East & North AfricaMiddle East & North Africa (excluding high income)Middle East & North Africa (IDA & IBRD countries)Middle incomeMoldovaMongoliaMontenegroMoroccoMozambiqueNamibiaNepalNetherlandsNew ZealandNicaraguaNigerNigeriaNorth AmericaNorwayOECD membersOmanOther small statesPacific island small statesPakistanPanamaPapua New GuineaParaguayPeruPhilippinesPolandPortugalPost-demographic dividendPre-demographic dividendQatarRomaniaRussian FederationRwandaSaudi ArabiaSenegalSerbiaSeychellesSierra LeoneSingaporeSlovak RepublicSloveniaSmall statesSolomon IslandsSouth AfricaSouth AsiaSouth Asia (IDA & IBRD)SpainSri LankaSt. Kitts and NevisSt. LuciaSt. Vincent and the GrenadinesSub-Saharan Africa Sub-Saharan Africa (excluding high income)Sub-Saharan Africa (IDA & IBRD countries)SudanSurinameSwazilandSwedenSwitzerlandSyrian Arab RepublicTajikistanTanzaniaThailandTimor-LesteTogoTongaTrinidad and TobagoTunisiaTurkeyTurkmenistanUgandaUkraineUnited KingdomUnited StatesUpper middle incomeUruguayVanuatuVenezuela, RBVietnamWest Bank and GazaWorldYemen, Rep.ZambiaZimbabwe Linha do tempo:
Nesta escala de tempo está apresentado um gráfico de 1972 ano até 2015 ano High income. Dados de 1971 ano ausente. O número de observações reais por data: 44.
Fonte (nome):
Indicadores de desenvolvimento mundial
Fonte (organização):
World Bank national accounts data files.
Categorias:
Economy & Growth, Environment
Foi atualizado:
23 abr 2017 ano
Indicadores de alterações dos valores ao longo dos anos
Mínimo:
19.363
1 jan 2010 ano
Máximo:
25.44
1 jan 1980 ano
Na data de observação
Valor
Mudança absoluta
A alteração em relação ao valor anterior
1 jan 1972 ano
23.856
+23.856
0.0%
1 jan 1973 ano
23.937
+0.081
0.34%
1 jan 1974 ano
25.14
+1.203
5.02%
1 jan 1975 ano
24.782
-0.358
-1.42%
1 jan 1976 ano
23.305
-1.477
-5.96%
1 jan 1977 ano
23.891
+0.587
2.52%
1 jan 1978 ano
24.901
+1.009
4.23%
1 jan 1979 ano
25.418
+0.517
2.08%
1 jan 1980 ano
25.44
+0.021
0.08%
1 jan 1981 ano
24.774
-0.665
-2.62%
1 jan 1982 ano
24.545
-0.229
-0.93%
1 jan 1983 ano
23.002
-1.543
-6.29%
1 jan 1984 ano
22.194
-0.808
-3.51%
1 jan 1985 ano
23.412
+1.218
5.49%
1 jan 1986 ano
22.882
-0.529
-2.26%
1 jan 1987 ano
22.964
+0.081
0.36%
1 jan 1988 ano
23.215
+0.251
1.09%
1 jan 1989 ano
24.305
+1.09
4.69%
1 jan 1990 ano
24.129
-0.175
-0.72%
1 jan 1991 ano
23.625
-0.504
-2.09%
1 jan 1992 ano
23.156
-0.47
-1.99%
1 jan 1993 ano
22.571
-0.584
-2.52%
1 jan 1994 ano
22.293
-0.279
-1.23%
1 jan 1995 ano
22.639
+0.346
1.55%
1 jan 1996 ano
23.329
+0.69
3.05%
1 jan 1997 ano
23.244
-0.085
-0.36%
1 jan 1998 ano
23.664
+0.421
1.81%
1 jan 1999 ano
23.449
-0.215
-0.91%
1 jan 2000 ano
22.95
-0.499
-2.13%
1 jan 2001 ano
23.22
+0.27
1.18%
1 jan 2002 ano
22.166
-1.054
-4.54%
1 jan 2003 ano
21.384
-0.782
-3.53%
1 jan 2004 ano
21.266
-0.118
-0.55%
1 jan 2005 ano
21.856
+0.59
2.77%
1 jan 2006 ano
22.086
+0.231
1.06%
1 jan 2007 ano
22.843
+0.757
3.43%
1 jan 2008 ano
22.71
-0.133
-0.58%
1 jan 2009 ano
21.601
-1.109
-4.89%
1 jan 2010 ano
19.363
-2.238
-10.36%
1 jan 2011 ano
20.412
+1.049
5.42%
1 jan 2012 ano
21.177
+0.765
3.75%
1 jan 2013 ano
21.571
+0.394
1.86%
1 jan 2014 ano
21.488
-0.083
-0.39%
1 jan 2015 ano
21.49
+0.001
0.01%
Classificação de países por estatísticas atuais por anos


Comentários: