29
/pt/
pt
AIzaSyAYiBZKx7MnpbEhh9jyipgxe19OcubqV5w
April 1, 2024
59596
Sub-Saharan Africa (excluding high income)
SSA
false
2
1
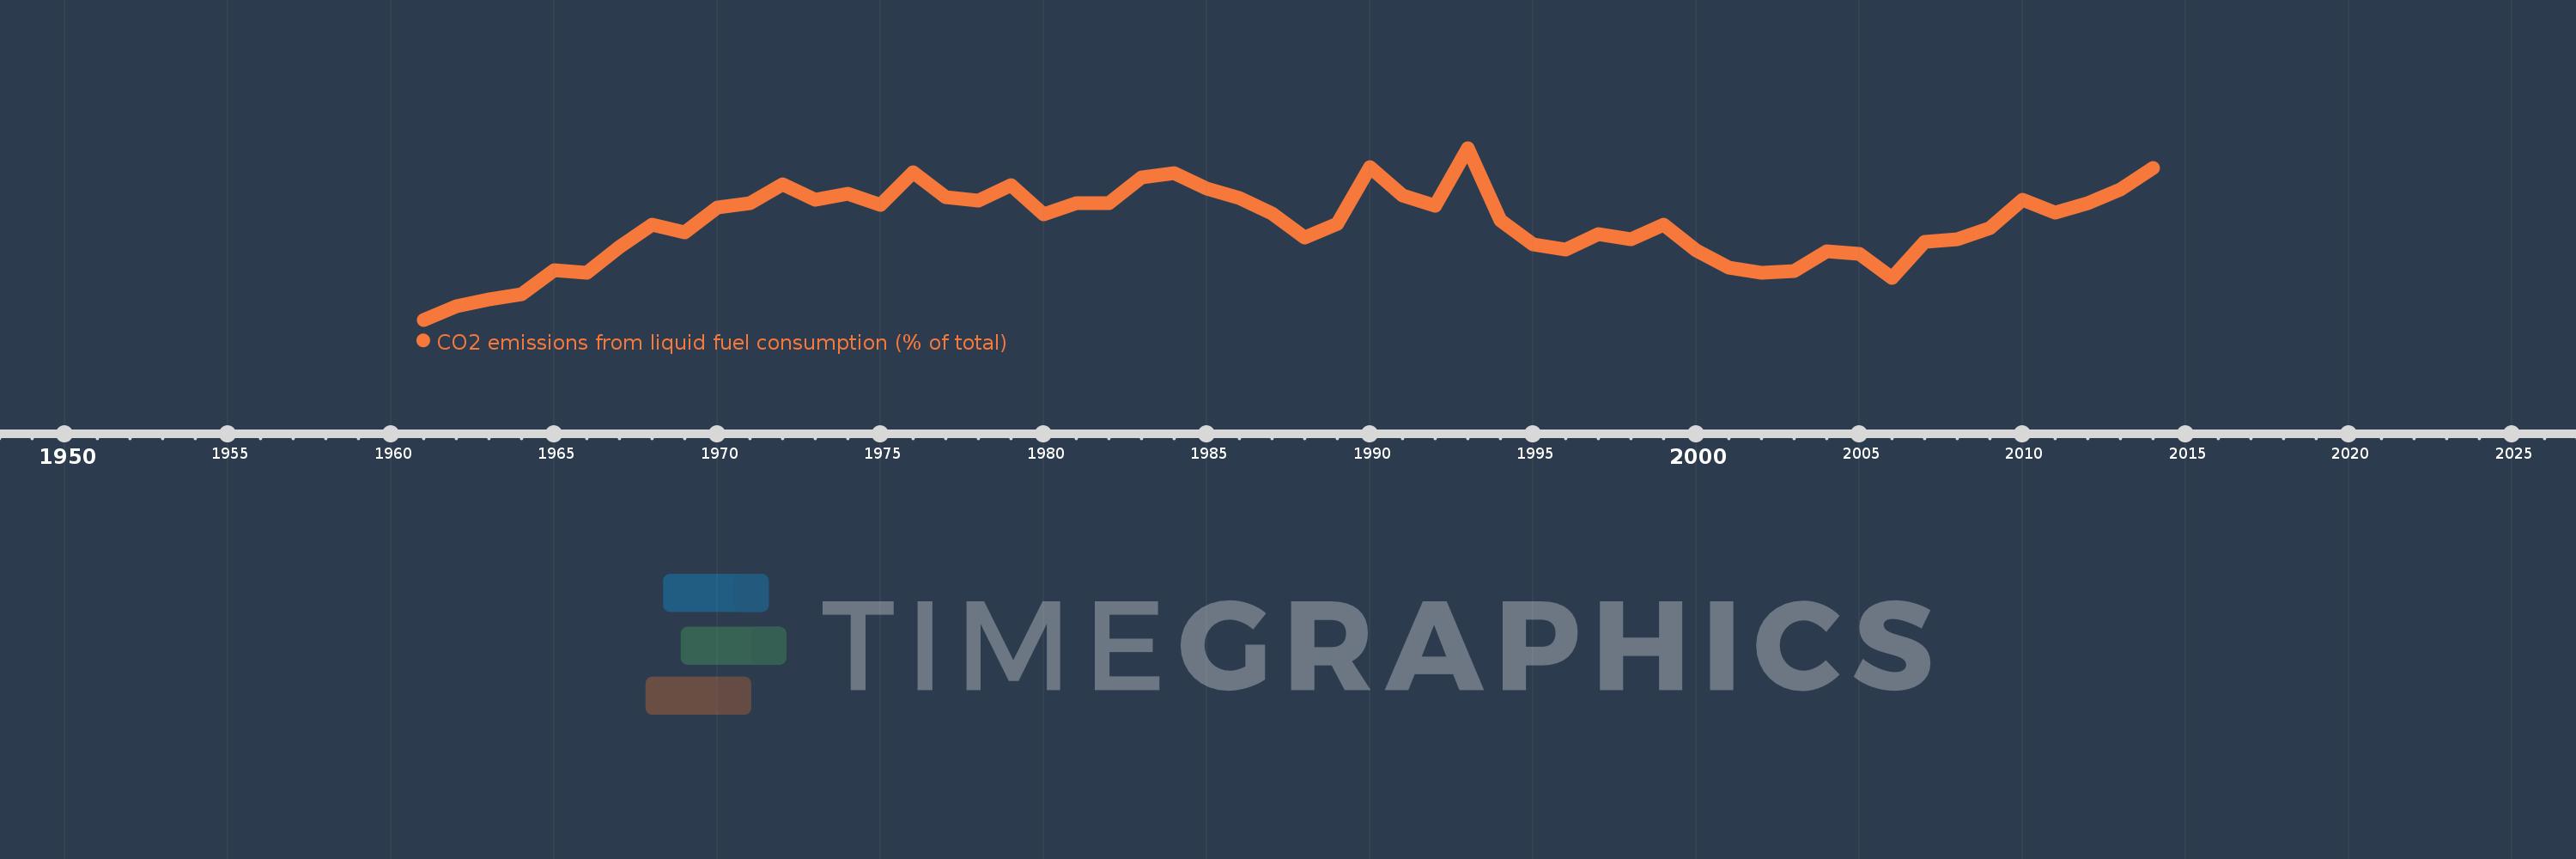
CO2 emissions from liquid fuel consumption (% of total)
2014,2013,2012,2011,2010,2009,2008,2007,2006,2005,2004,2003,2002,2001,2000,1999,1998,1997,1996,1995,1994,1993,1992,1991,1990,1989,1988,1987,1986,1985,1984,1983,1982,1981,1980,1979,1978,1977,1976,1975,1974,1973,1972,1971,1970,1969,1968,1967,1966,1965,1964,1963,1962,1961
Estas estatísticas em outros países:
AfghanistanAlbaniaAlgeriaAndorraAngolaAntigua and BarbudaArab WorldArgentinaArmeniaArubaAustraliaAustriaAzerbaijanBahamas, TheBahrainBangladeshBarbadosBelarusBelgiumBelizeBeninBermudaBhutanBoliviaBosnia and HerzegovinaBotswanaBrazilBritish Virgin IslandsBrunei DarussalamBulgariaBurkina FasoBurundiCabo VerdeCambodiaCameroonCanadaCaribbean small statesCayman IslandsCentral African RepublicCentral Europe and the BalticsChadChileChinaColombiaComorosCongo, Dem. Rep.Congo, Rep.Costa RicaCote d'IvoireCroatiaCubaCuracaoCyprusCzech RepublicDenmarkDjiboutiDominicaDominican RepublicEarly-demographic dividendEast Asia & PacificEast Asia & Pacific (excluding high income)East Asia & Pacific (IDA & IBRD countries)EcuadorEgypt, Arab Rep.El SalvadorEquatorial GuineaEritreaEstoniaEthiopiaEuro areaEurope & Central AsiaEurope & Central Asia (excluding high income)Europe & Central Asia (IDA & IBRD countries)European UnionFaroe IslandsFijiFinlandFragile and conflict affected situationsFranceFrench PolynesiaGabonGambia, TheGeorgiaGermanyGhanaGibraltarGreeceGreenlandGrenadaGuatemalaGuineaGuinea-BissauGuyanaHaitiHeavily indebted poor countries (HIPC)High incomeHondurasHong Kong SAR, ChinaHungaryIBRD onlyIcelandIDA & IBRD totalIDA blendIDA onlyIDA totalIndiaIndonesiaIran, Islamic Rep.IraqIrelandIsraelItalyJamaicaJapanJordanKazakhstanKenyaKiribatiKorea, Dem. People’s Rep.Korea, Rep.KuwaitKyrgyz RepublicLao PDRLate-demographic dividendLatin America & Caribbean Latin America & Caribbean (excluding high income)Latin America & the Caribbean (IDA & IBRD countries)LatviaLeast developed countries: UN classificationLebanonLesothoLiberiaLibyaLiechtensteinLithuaniaLow & middle incomeLow incomeLower middle incomeLuxembourgMacao SAR, ChinaMacedonia, FYRMadagascarMalawiMalaysiaMaldivesMaliMaltaMarshall IslandsMauritaniaMauritiusMexicoMicronesia, Fed. Sts.Middle East & North AfricaMiddle East & North Africa (excluding high income)Middle East & North Africa (IDA & IBRD countries)Middle incomeMoldovaMongoliaMontenegroMoroccoMozambiqueMyanmarNamibiaNauruNepalNetherlandsNew CaledoniaNew ZealandNicaraguaNigerNigeriaNorth AmericaNorwayOECD membersOmanOther small statesPacific island small statesPakistanPalauPanamaPapua New GuineaParaguayPeruPhilippinesPolandPortugalPost-demographic dividendPre-demographic dividendQatarRomaniaRussian FederationRwandaSamoaSao Tome and PrincipeSaudi ArabiaSenegalSerbiaSeychellesSierra LeoneSingaporeSint Maarten (Dutch part)Slovak RepublicSloveniaSmall statesSolomon IslandsSomaliaSouth AfricaSouth AsiaSouth Asia (IDA & IBRD)South SudanSpainSri LankaSt. Kitts and NevisSt. LuciaSt. Vincent and the GrenadinesSub-Saharan Africa Sub-Saharan Africa (excluding high income)Sub-Saharan Africa (IDA & IBRD countries)SudanSurinameSwazilandSwedenSwitzerlandSyrian Arab RepublicTajikistanTanzaniaThailandTimor-LesteTogoTongaTrinidad and TobagoTunisiaTurkeyTurkmenistanTurks and Caicos IslandsUgandaUkraineUnited Arab EmiratesUnited KingdomUnited StatesUpper middle incomeUruguayUzbekistanVanuatuVenezuela, RBVietnamWest Bank and GazaWorldYemen, Rep.ZambiaZimbabwe Linha do tempo:
Nesta escala de tempo está apresentado um gráfico de 1961 ano até 2014 ano Sub-Saharan Africa (excluding high income). Dados de 1960 ano ausente. O número de observações reais por data: 54.
Fonte (nome):
Indicadores de desenvolvimento mundial
Fonte (organização):
Carbon Dioxide Information Analysis Center, Environmental Sciences Division, Oak Ridge National Laboratory, Tennessee, United States.
Categorias:
Climate Change, Environment
Foi atualizado:
23 abr 2017 ano
Indicadores de alterações dos valores ao longo dos anos
Mínimo:
20.095
1 jan 1961 ano
Máximo:
32.408
1 jan 1993 ano
Na data de observação
Valor
Mudança absoluta
A alteração em relação ao valor anterior
1 jan 1961 ano
20.095
+20.095
0.0%
1 jan 1962 ano
21.077
+0.983
4.89%
1 jan 1963 ano
21.554
+0.477
2.26%
1 jan 1964 ano
21.924
+0.37
1.72%
1 jan 1965 ano
23.656
+1.733
7.9%
1 jan 1966 ano
23.446
-0.211
-0.89%
1 jan 1967 ano
25.313
+1.868
7.97%
1 jan 1968 ano
26.89
+1.577
6.23%
1 jan 1969 ano
26.385
-0.505
-1.88%
1 jan 1970 ano
28.126
+1.741
6.6%
1 jan 1971 ano
28.455
+0.329
1.17%
1 jan 1972 ano
29.796
+1.34
4.71%
1 jan 1973 ano
28.71
-1.085
-3.64%
1 jan 1974 ano
29.15
+0.44
1.53%
1 jan 1975 ano
28.331
-0.819
-2.81%
1 jan 1976 ano
30.671
+2.34
8.26%
1 jan 1977 ano
28.91
-1.76
-5.74%
1 jan 1978 ano
28.632
-0.278
-0.96%
1 jan 1979 ano
29.738
+1.106
3.86%
1 jan 1980 ano
27.663
-2.075
-6.98%
1 jan 1981 ano
28.463
+0.799
2.89%
1 jan 1982 ano
28.464
+0.001
0.0%
1 jan 1983 ano
30.317
+1.853
6.51%
1 jan 1984 ano
30.617
+0.301
0.99%
1 jan 1985 ano
29.52
-1.097
-3.58%
1 jan 1986 ano
28.8
-0.721
-2.44%
1 jan 1987 ano
27.734
-1.065
-3.7%
1 jan 1988 ano
25.988
-1.746
-6.3%
1 jan 1989 ano
26.981
+0.993
3.82%
1 jan 1990 ano
31.009
+4.029
14.93%
1 jan 1991 ano
28.98
-2.029
-6.54%
1 jan 1992 ano
28.293
-0.687
-2.37%
1 jan 1993 ano
32.408
+4.116
14.55%
1 jan 1994 ano
27.228
-5.181
-15.99%
1 jan 1995 ano
25.505
-1.722
-6.33%
1 jan 1996 ano
25.129
-0.377
-1.48%
1 jan 1997 ano
26.241
+1.113
4.43%
1 jan 1998 ano
25.839
-0.403
-1.53%
1 jan 1999 ano
26.937
+1.099
4.25%
1 jan 2000 ano
25.061
-1.876
-6.97%
1 jan 2001 ano
23.85
-1.211
-4.83%
1 jan 2002 ano
23.435
-0.415
-1.74%
1 jan 2003 ano
23.6
+0.164
0.7%
1 jan 2004 ano
24.974
+1.374
5.82%
1 jan 2005 ano
24.787
-0.186
-0.75%
1 jan 2006 ano
23.103
-1.685
-6.8%
1 jan 2007 ano
25.649
+2.546
11.02%
1 jan 2008 ano
25.894
+0.246
0.96%
1 jan 2009 ano
26.669
+0.774
2.99%
1 jan 2010 ano
28.719
+2.051
7.69%
1 jan 2011 ano
27.793
-0.927
-3.23%
1 jan 2012 ano
28.423
+0.63
2.27%
1 jan 2013 ano
29.459
+1.037
3.65%
1 jan 2014 ano
30.969
+1.51
5.13%
Classificação de países por estatísticas atuais por anos


Comentários: