29
/pt/
pt
AIzaSyAYiBZKx7MnpbEhh9jyipgxe19OcubqV5w
April 1, 2024
42171
Latin America & Caribbean (excluding high income)
LAC
false
2
1
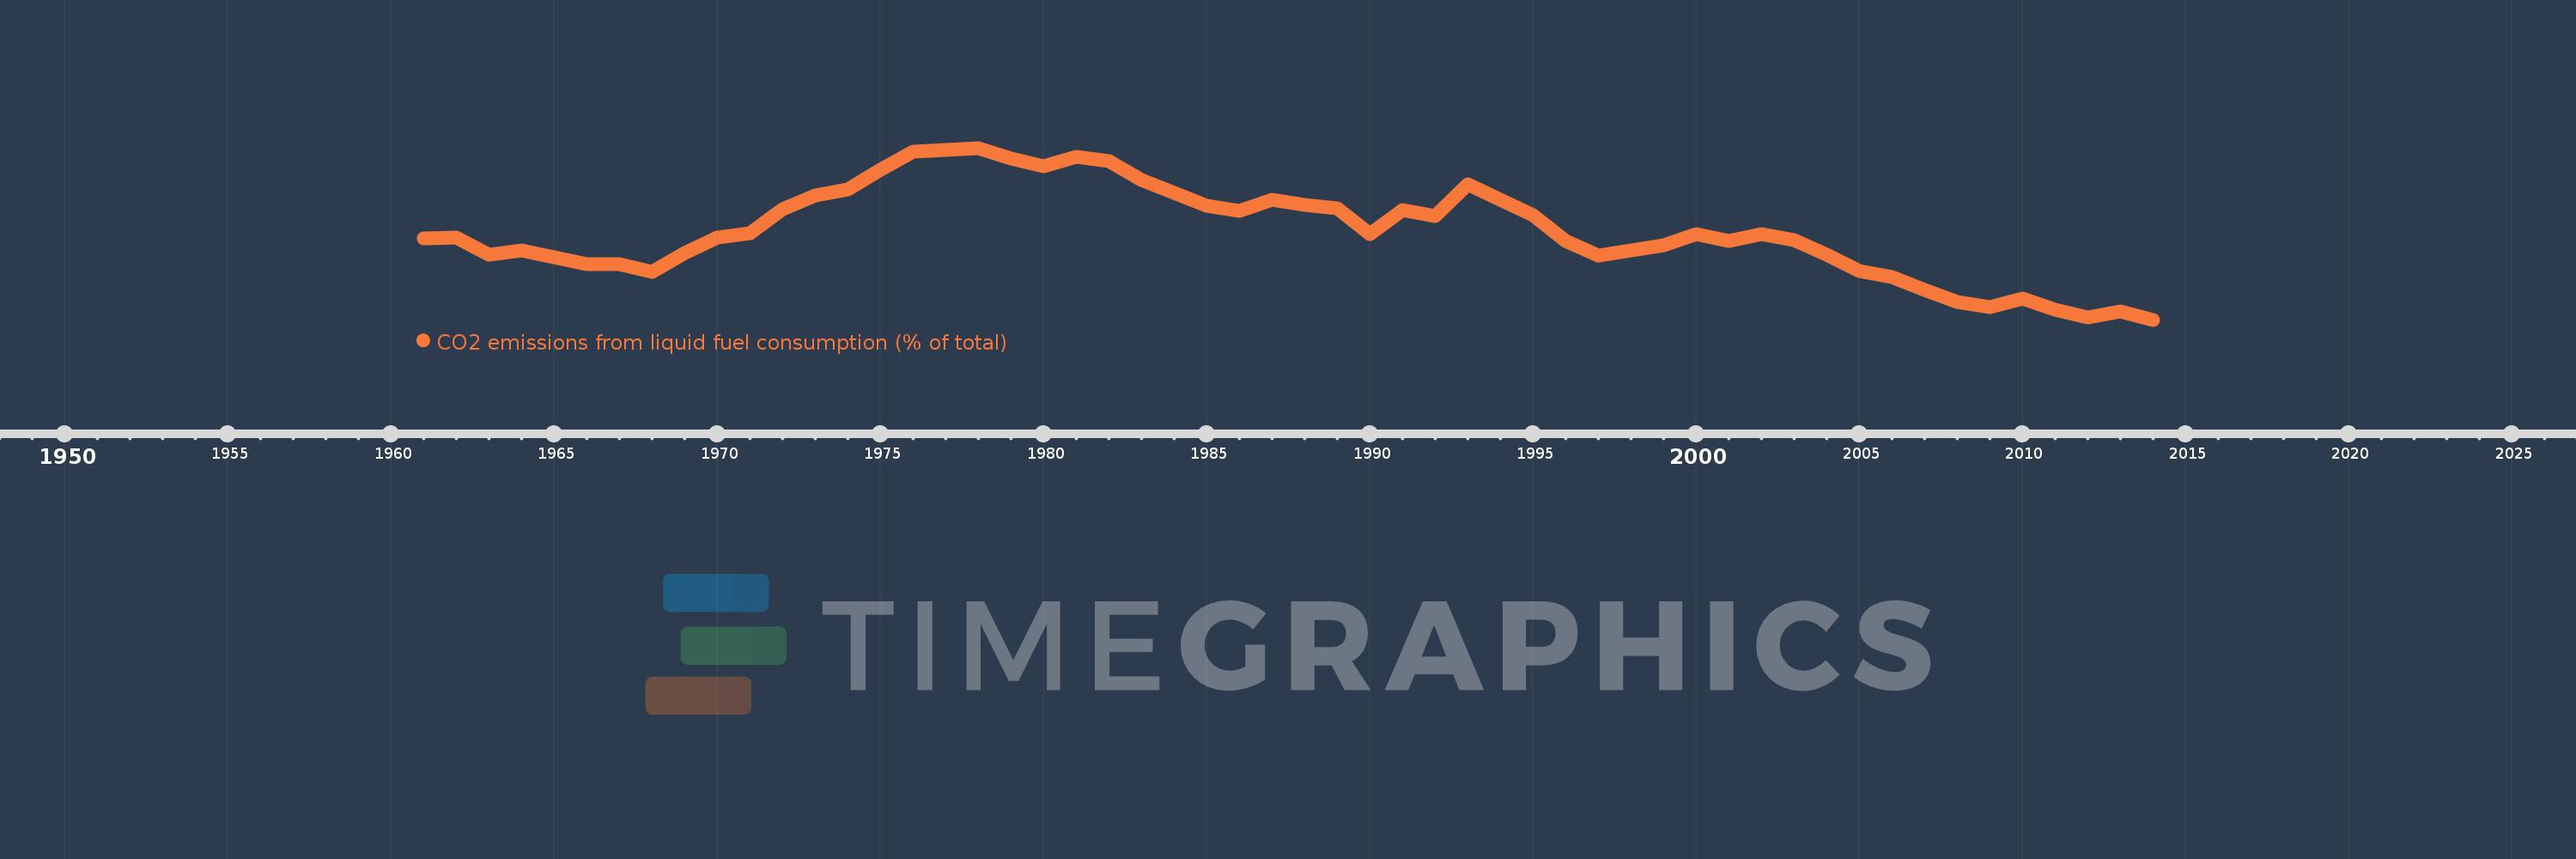
CO2 emissions from liquid fuel consumption (% of total)
2014,2013,2012,2011,2010,2009,2008,2007,2006,2005,2004,2003,2002,2001,2000,1999,1998,1997,1996,1995,1994,1993,1992,1991,1990,1989,1988,1987,1986,1985,1984,1983,1982,1981,1980,1979,1978,1977,1976,1975,1974,1973,1972,1971,1970,1969,1968,1967,1966,1965,1964,1963,1962,1961
Estas estatísticas em outros países:
AfghanistanAlbaniaAlgeriaAndorraAngolaAntigua and BarbudaArab WorldArgentinaArmeniaArubaAustraliaAustriaAzerbaijanBahamas, TheBahrainBangladeshBarbadosBelarusBelgiumBelizeBeninBermudaBhutanBoliviaBosnia and HerzegovinaBotswanaBrazilBritish Virgin IslandsBrunei DarussalamBulgariaBurkina FasoBurundiCabo VerdeCambodiaCameroonCanadaCaribbean small statesCayman IslandsCentral African RepublicCentral Europe and the BalticsChadChileChinaColombiaComorosCongo, Dem. Rep.Congo, Rep.Costa RicaCote d'IvoireCroatiaCubaCuracaoCyprusCzech RepublicDenmarkDjiboutiDominicaDominican RepublicEarly-demographic dividendEast Asia & PacificEast Asia & Pacific (excluding high income)East Asia & Pacific (IDA & IBRD countries)EcuadorEgypt, Arab Rep.El SalvadorEquatorial GuineaEritreaEstoniaEthiopiaEuro areaEurope & Central AsiaEurope & Central Asia (excluding high income)Europe & Central Asia (IDA & IBRD countries)European UnionFaroe IslandsFijiFinlandFragile and conflict affected situationsFranceFrench PolynesiaGabonGambia, TheGeorgiaGermanyGhanaGibraltarGreeceGreenlandGrenadaGuatemalaGuineaGuinea-BissauGuyanaHaitiHeavily indebted poor countries (HIPC)High incomeHondurasHong Kong SAR, ChinaHungaryIBRD onlyIcelandIDA & IBRD totalIDA blendIDA onlyIDA totalIndiaIndonesiaIran, Islamic Rep.IraqIrelandIsraelItalyJamaicaJapanJordanKazakhstanKenyaKiribatiKorea, Dem. People’s Rep.Korea, Rep.KuwaitKyrgyz RepublicLao PDRLate-demographic dividendLatin America & Caribbean Latin America & Caribbean (excluding high income)Latin America & the Caribbean (IDA & IBRD countries)LatviaLeast developed countries: UN classificationLebanonLesothoLiberiaLibyaLiechtensteinLithuaniaLow & middle incomeLow incomeLower middle incomeLuxembourgMacao SAR, ChinaMacedonia, FYRMadagascarMalawiMalaysiaMaldivesMaliMaltaMarshall IslandsMauritaniaMauritiusMexicoMicronesia, Fed. Sts.Middle East & North AfricaMiddle East & North Africa (excluding high income)Middle East & North Africa (IDA & IBRD countries)Middle incomeMoldovaMongoliaMontenegroMoroccoMozambiqueMyanmarNamibiaNauruNepalNetherlandsNew CaledoniaNew ZealandNicaraguaNigerNigeriaNorth AmericaNorwayOECD membersOmanOther small statesPacific island small statesPakistanPalauPanamaPapua New GuineaParaguayPeruPhilippinesPolandPortugalPost-demographic dividendPre-demographic dividendQatarRomaniaRussian FederationRwandaSamoaSao Tome and PrincipeSaudi ArabiaSenegalSerbiaSeychellesSierra LeoneSingaporeSint Maarten (Dutch part)Slovak RepublicSloveniaSmall statesSolomon IslandsSomaliaSouth AfricaSouth AsiaSouth Asia (IDA & IBRD)South SudanSpainSri LankaSt. Kitts and NevisSt. LuciaSt. Vincent and the GrenadinesSub-Saharan Africa Sub-Saharan Africa (excluding high income)Sub-Saharan Africa (IDA & IBRD countries)SudanSurinameSwazilandSwedenSwitzerlandSyrian Arab RepublicTajikistanTanzaniaThailandTimor-LesteTogoTongaTrinidad and TobagoTunisiaTurkeyTurkmenistanTurks and Caicos IslandsUgandaUkraineUnited Arab EmiratesUnited KingdomUnited StatesUpper middle incomeUruguayUzbekistanVanuatuVenezuela, RBVietnamWest Bank and GazaWorldYemen, Rep.ZambiaZimbabwe Linha do tempo:
Nesta escala de tempo está apresentado um gráfico de 1961 ano até 2014 ano Latin America & Caribbean (excluding high income). Dados de 1960 ano ausente. O número de observações reais por data: 54.
Fonte (nome):
Indicadores de desenvolvimento mundial
Fonte (organização):
Carbon Dioxide Information Analysis Center, Environmental Sciences Division, Oak Ridge National Laboratory, Tennessee, United States.
Categorias:
Climate Change, Environment
Foi atualizado:
23 abr 2017 ano
Indicadores de alterações dos valores ao longo dos anos
Mínimo:
60.253
1 jan 2014 ano
Máximo:
74.471
1 jan 1978 ano
Na data de observação
Valor
Mudança absoluta
A alteração em relação ao valor anterior
1 jan 1961 ano
66.958
+66.958
0.0%
1 jan 1962 ano
67.03
+0.073
0.11%
1 jan 1963 ano
65.604
-1.427
-2.13%
1 jan 1964 ano
66.023
+0.419
0.64%
1 jan 1965 ano
65.404
-0.619
-0.94%
1 jan 1966 ano
64.867
-0.537
-0.82%
1 jan 1967 ano
64.88
+0.013
0.02%
1 jan 1968 ano
64.213
-0.667
-1.03%
1 jan 1969 ano
65.773
+1.56
2.43%
1 jan 1970 ano
67.051
+1.278
1.94%
1 jan 1971 ano
67.397
+0.346
0.52%
1 jan 1972 ano
69.388
+1.991
2.95%
1 jan 1973 ano
70.546
+1.157
1.67%
1 jan 1974 ano
71.036
+0.49
0.69%
1 jan 1975 ano
72.68
+1.644
2.32%
1 jan 1976 ano
74.188
+1.508
2.07%
1 jan 1977 ano
74.34
+0.152
0.2%
1 jan 1978 ano
74.471
+0.131
0.18%
1 jan 1979 ano
73.57
-0.901
-1.21%
1 jan 1980 ano
72.958
-0.613
-0.83%
1 jan 1981 ano
73.743
+0.785
1.08%
1 jan 1982 ano
73.352
-0.39
-0.53%
1 jan 1983 ano
71.846
-1.506
-2.05%
1 jan 1984 ano
70.763
-1.082
-1.51%
1 jan 1985 ano
69.703
-1.06
-1.5%
1 jan 1986 ano
69.278
-0.425
-0.61%
1 jan 1987 ano
70.201
+0.923
1.33%
1 jan 1988 ano
69.753
-0.448
-0.64%
1 jan 1989 ano
69.446
-0.306
-0.44%
1 jan 1990 ano
67.335
-2.111
-3.04%
1 jan 1991 ano
69.337
+2.002
2.97%
1 jan 1992 ano
68.849
-0.488
-0.7%
1 jan 1993 ano
71.466
+2.617
3.8%
1 jan 1994 ano
70.154
-1.312
-1.84%
1 jan 1995 ano
68.899
-1.255
-1.79%
1 jan 1996 ano
66.805
-2.094
-3.04%
1 jan 1997 ano
65.578
-1.227
-1.84%
1 jan 1998 ano
65.975
+0.397
0.61%
1 jan 1999 ano
66.441
+0.466
0.71%
1 jan 2000 ano
67.371
+0.93
1.4%
1 jan 2001 ano
66.754
-0.618
-0.92%
1 jan 2002 ano
67.362
+0.609
0.91%
1 jan 2003 ano
66.868
-0.494
-0.73%
1 jan 2004 ano
65.62
-1.249
-1.87%
1 jan 2005 ano
64.285
-1.335
-2.03%
1 jan 2006 ano
63.774
-0.511
-0.79%
1 jan 2007 ano
62.748
-1.026
-1.61%
1 jan 2008 ano
61.698
-1.051
-1.67%
1 jan 2009 ano
61.28
-0.418
-0.68%
1 jan 2010 ano
62.028
+0.748
1.22%
1 jan 2011 ano
61.069
-0.959
-1.55%
1 jan 2012 ano
60.44
-0.629
-1.03%
1 jan 2013 ano
60.95
+0.51
0.84%
1 jan 2014 ano
60.253
-0.698
-1.14%
Classificação de países por estatísticas atuais por anos


Comentários: