29
/pt/
pt
AIzaSyAYiBZKx7MnpbEhh9jyipgxe19OcubqV5w
April 1, 2024
27931
East Asia & Pacific (excluding high income)
EAP
false
2
1
CO2 emissions from liquid fuel consumption (% of total)
2014,2013,2012,2011,2010,2009,2008,2007,2006,2005,2004,2003,2002,2001,2000,1999,1998,1997,1996,1995,1994,1993,1992,1991,1990,1989,1988,1987,1986,1985,1984,1983,1982,1981,1980,1979,1978,1977,1976,1975,1974,1973,1972,1971,1970,1969,1968,1967,1966,1965,1964,1963,1962,1961
Estas estatísticas em outros países:
AfghanistanAlbaniaAlgeriaAndorraAngolaAntigua and BarbudaArab WorldArgentinaArmeniaArubaAustraliaAustriaAzerbaijanBahamas, TheBahrainBangladeshBarbadosBelarusBelgiumBelizeBeninBermudaBhutanBoliviaBosnia and HerzegovinaBotswanaBrazilBritish Virgin IslandsBrunei DarussalamBulgariaBurkina FasoBurundiCabo VerdeCambodiaCameroonCanadaCaribbean small statesCayman IslandsCentral African RepublicCentral Europe and the BalticsChadChileChinaColombiaComorosCongo, Dem. Rep.Congo, Rep.Costa RicaCote d'IvoireCroatiaCubaCuracaoCyprusCzech RepublicDenmarkDjiboutiDominicaDominican RepublicEarly-demographic dividendEast Asia & PacificEast Asia & Pacific (excluding high income)East Asia & Pacific (IDA & IBRD countries)EcuadorEgypt, Arab Rep.El SalvadorEquatorial GuineaEritreaEstoniaEthiopiaEuro areaEurope & Central AsiaEurope & Central Asia (excluding high income)Europe & Central Asia (IDA & IBRD countries)European UnionFaroe IslandsFijiFinlandFragile and conflict affected situationsFranceFrench PolynesiaGabonGambia, TheGeorgiaGermanyGhanaGibraltarGreeceGreenlandGrenadaGuatemalaGuineaGuinea-BissauGuyanaHaitiHeavily indebted poor countries (HIPC)High incomeHondurasHong Kong SAR, ChinaHungaryIBRD onlyIcelandIDA & IBRD totalIDA blendIDA onlyIDA totalIndiaIndonesiaIran, Islamic Rep.IraqIrelandIsraelItalyJamaicaJapanJordanKazakhstanKenyaKiribatiKorea, Dem. People’s Rep.Korea, Rep.KuwaitKyrgyz RepublicLao PDRLate-demographic dividendLatin America & Caribbean Latin America & Caribbean (excluding high income)Latin America & the Caribbean (IDA & IBRD countries)LatviaLeast developed countries: UN classificationLebanonLesothoLiberiaLibyaLiechtensteinLithuaniaLow & middle incomeLow incomeLower middle incomeLuxembourgMacao SAR, ChinaMacedonia, FYRMadagascarMalawiMalaysiaMaldivesMaliMaltaMarshall IslandsMauritaniaMauritiusMexicoMicronesia, Fed. Sts.Middle East & North AfricaMiddle East & North Africa (excluding high income)Middle East & North Africa (IDA & IBRD countries)Middle incomeMoldovaMongoliaMontenegroMoroccoMozambiqueMyanmarNamibiaNauruNepalNetherlandsNew CaledoniaNew ZealandNicaraguaNigerNigeriaNorth AmericaNorwayOECD membersOmanOther small statesPacific island small statesPakistanPalauPanamaPapua New GuineaParaguayPeruPhilippinesPolandPortugalPost-demographic dividendPre-demographic dividendQatarRomaniaRussian FederationRwandaSamoaSao Tome and PrincipeSaudi ArabiaSenegalSerbiaSeychellesSierra LeoneSingaporeSint Maarten (Dutch part)Slovak RepublicSloveniaSmall statesSolomon IslandsSomaliaSouth AfricaSouth AsiaSouth Asia (IDA & IBRD)South SudanSpainSri LankaSt. Kitts and NevisSt. LuciaSt. Vincent and the GrenadinesSub-Saharan Africa Sub-Saharan Africa (excluding high income)Sub-Saharan Africa (IDA & IBRD countries)SudanSurinameSwazilandSwedenSwitzerlandSyrian Arab RepublicTajikistanTanzaniaThailandTimor-LesteTogoTongaTrinidad and TobagoTunisiaTurkeyTurkmenistanTurks and Caicos IslandsUgandaUkraineUnited Arab EmiratesUnited KingdomUnited StatesUpper middle incomeUruguayUzbekistanVanuatuVenezuela, RBVietnamWest Bank and GazaWorldYemen, Rep.ZambiaZimbabwe Linha do tempo:
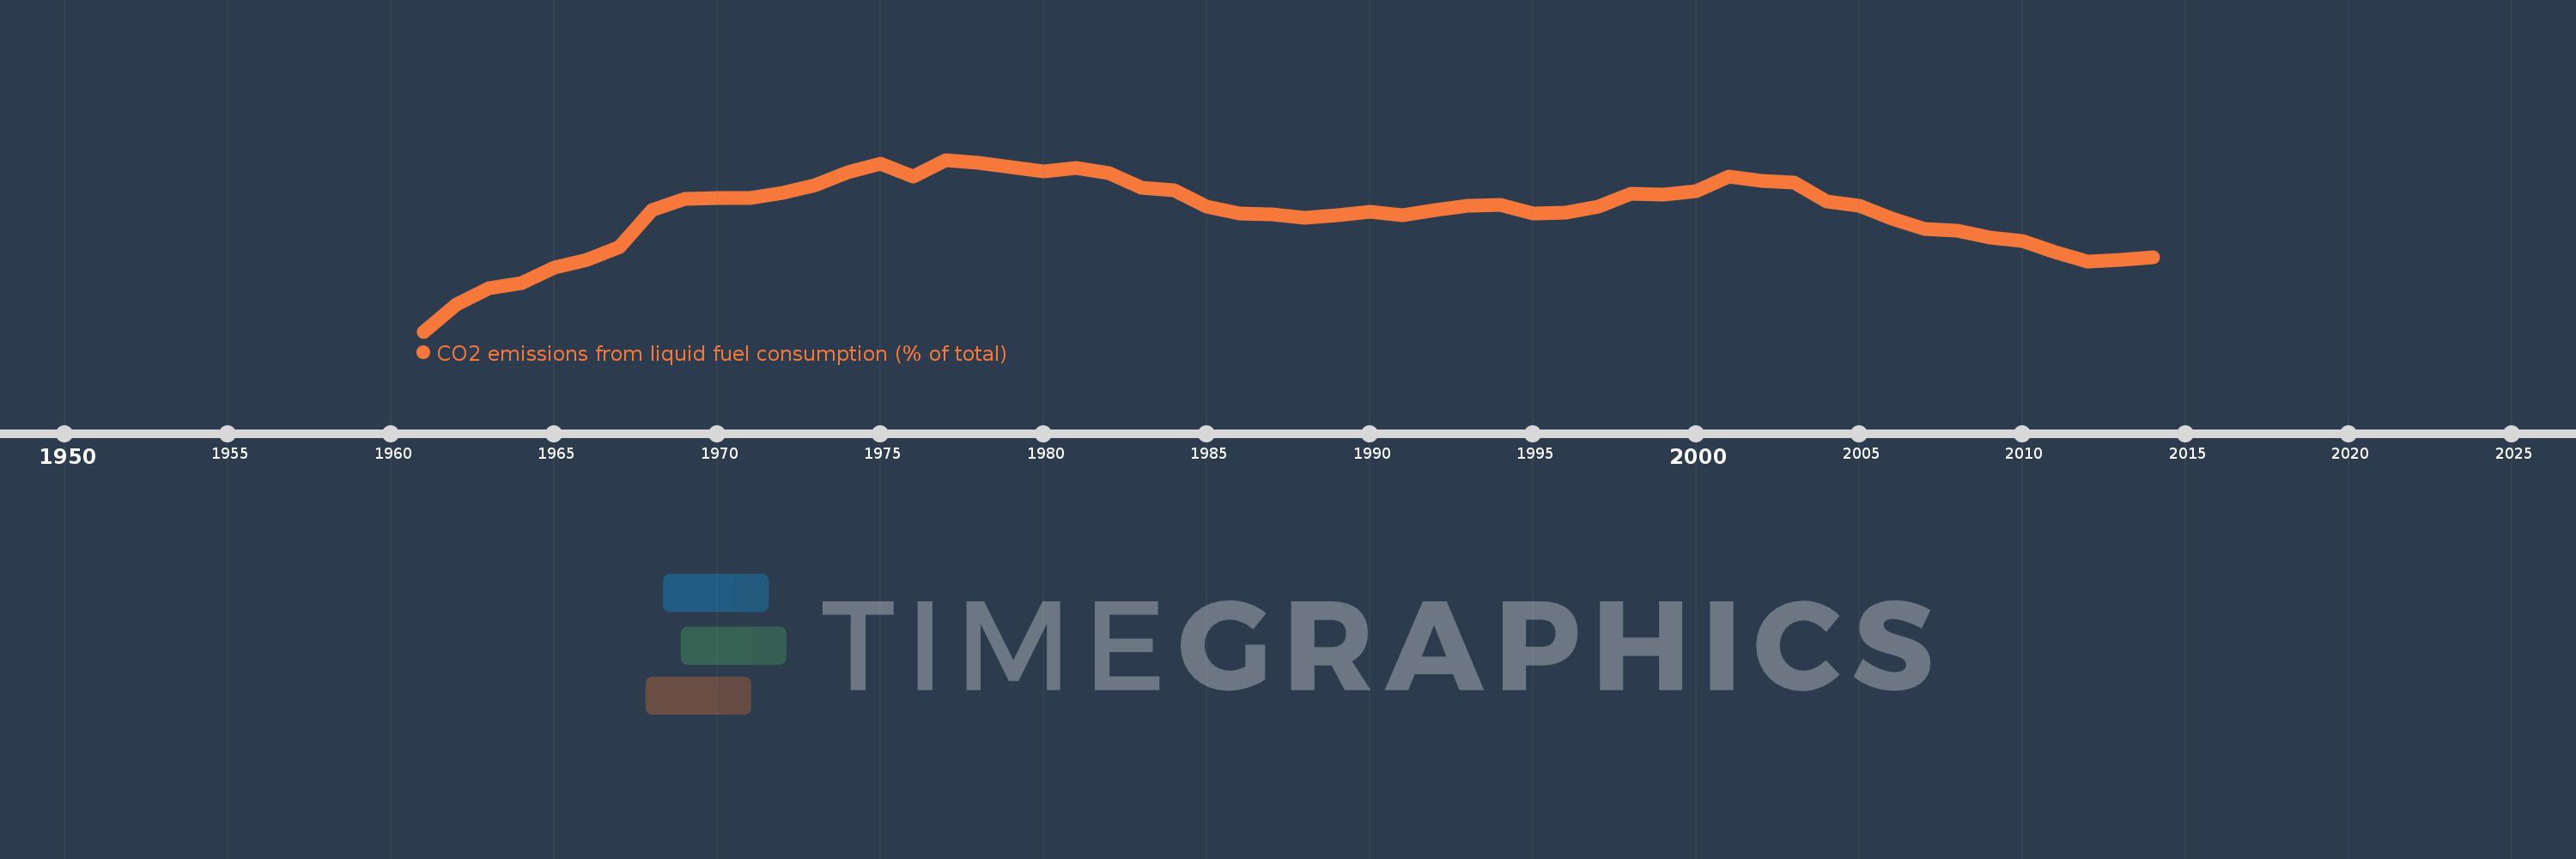
Nesta escala de tempo está apresentado um gráfico de 1961 ano até 2014 ano East Asia & Pacific (excluding high income). Dados de 1960 ano ausente. O número de observações reais por data: 54.
Fonte (nome):
Indicadores de desenvolvimento mundial
Fonte (organização):
Carbon Dioxide Information Analysis Center, Environmental Sciences Division, Oak Ridge National Laboratory, Tennessee, United States.
Categorias:
Climate Change, Environment
Foi atualizado:
23 abr 2017 ano
Indicadores de alterações dos valores ao longo dos anos
Mínimo:
6.477
1 jan 1961 ano
Máximo:
27.123
1 jan 1977 ano
Na data de observação
Valor
Mudança absoluta
A alteração em relação ao valor anterior
1 jan 1961 ano
6.477
+6.477
0.0%
1 jan 1962 ano
9.702
+3.226
49.81%
1 jan 1963 ano
11.644
+1.942
20.01%
1 jan 1964 ano
12.332
+0.688
5.91%
1 jan 1965 ano
14.207
+1.875
15.2%
1 jan 1966 ano
15.079
+0.872
6.14%
1 jan 1967 ano
16.692
+1.612
10.69%
1 jan 1968 ano
21.047
+4.355
26.09%
1 jan 1969 ano
22.376
+1.329
6.32%
1 jan 1970 ano
22.576
+0.2
0.89%
1 jan 1971 ano
22.511
-0.065
-0.29%
1 jan 1972 ano
23.129
+0.619
2.75%
1 jan 1973 ano
24.073
+0.944
4.08%
1 jan 1974 ano
25.665
+1.592
6.61%
1 jan 1975 ano
26.707
+1.042
4.06%
1 jan 1976 ano
25.115
-1.592
-5.96%
1 jan 1977 ano
27.123
+2.008
7.99%
1 jan 1978 ano
26.795
-0.328
-1.21%
1 jan 1979 ano
26.255
-0.539
-2.01%
1 jan 1980 ano
25.775
-0.48
-1.83%
1 jan 1981 ano
26.176
+0.402
1.56%
1 jan 1982 ano
25.541
-0.635
-2.43%
1 jan 1983 ano
23.777
-1.764
-6.91%
1 jan 1984 ano
23.485
-0.291
-1.23%
1 jan 1985 ano
21.532
-1.954
-8.32%
1 jan 1986 ano
20.663
-0.869
-4.03%
1 jan 1987 ano
20.59
-0.073
-0.35%
1 jan 1988 ano
20.167
-0.423
-2.06%
1 jan 1989 ano
20.502
+0.336
1.66%
1 jan 1990 ano
20.876
+0.373
1.82%
1 jan 1991 ano
20.42
-0.455
-2.18%
1 jan 1992 ano
21.078
+0.657
3.22%
1 jan 1993 ano
21.576
+0.498
2.36%
1 jan 1994 ano
21.736
+0.16
0.74%
1 jan 1995 ano
20.652
-1.085
-4.99%
1 jan 1996 ano
20.788
+0.136
0.66%
1 jan 1997 ano
21.5
+0.712
3.43%
1 jan 1998 ano
23.08
+1.58
7.35%
1 jan 1999 ano
22.923
-0.157
-0.68%
1 jan 2000 ano
23.4
+0.477
2.08%
1 jan 2001 ano
25.127
+1.727
7.38%
1 jan 2002 ano
24.588
-0.539
-2.14%
1 jan 2003 ano
24.366
-0.223
-0.91%
1 jan 2004 ano
22.12
-2.245
-9.21%
1 jan 2005 ano
21.636
-0.485
-2.19%
1 jan 2006 ano
20.059
-1.576
-7.29%
1 jan 2007 ano
18.789
-1.27
-6.33%
1 jan 2008 ano
18.586
-0.203
-1.08%
1 jan 2009 ano
17.8
-0.786
-4.23%
1 jan 2010 ano
17.36
-0.44
-2.47%
1 jan 2011 ano
16.047
-1.313
-7.56%
1 jan 2012 ano
14.906
-1.141
-7.11%
1 jan 2013 ano
15.084
+0.178
1.19%
1 jan 2014 ano
15.404
+0.32
2.12%
Classificação de países por estatísticas atuais por anos


Comentários: