29
/pt/
pt
AIzaSyAYiBZKx7MnpbEhh9jyipgxe19OcubqV5w
April 1, 2024
56273
Small states
SST
false
2
1
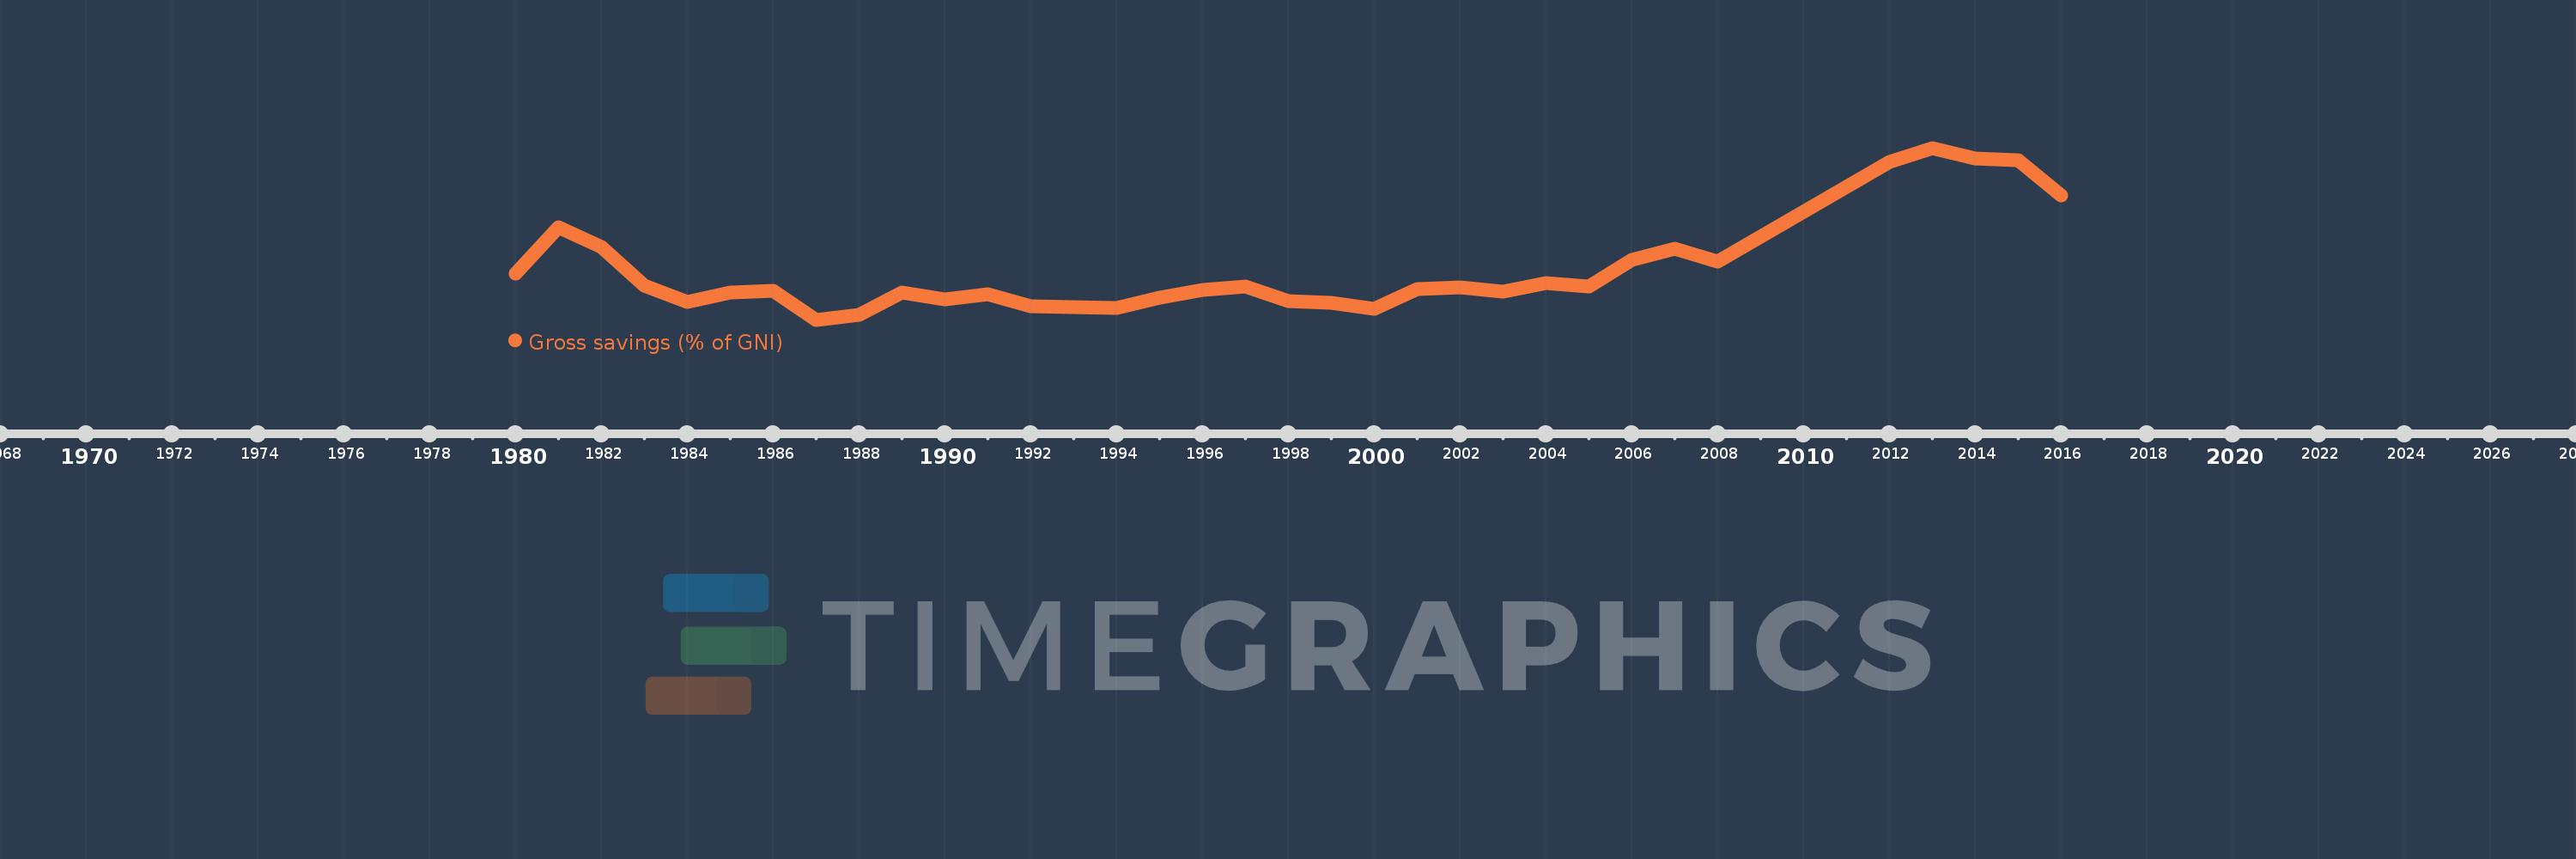
Gross savings (% of GNI)
2016,2015,2014,2013,2012,2008,2007,2006,2005,2004,2003,2002,2001,2000,1999,1998,1997,1996,1995,1994,1993,1992,1991,1990,1989,1988,1987,1986,1985,1984,1983,1982,1981,1980
Estas estatísticas em outros países:
AfghanistanAlbaniaAlgeriaAngolaAntigua and BarbudaArab WorldArgentinaArmeniaAustraliaAustriaAzerbaijanBahamas, TheBahrainBangladeshBarbadosBelarusBelgiumBelizeBeninBermudaBhutanBoliviaBosnia and HerzegovinaBotswanaBrazilBrunei DarussalamBulgariaBurkina FasoBurundiCabo VerdeCambodiaCameroonCanadaCaribbean small statesCentral African RepublicCentral Europe and the BalticsChadChileChinaColombiaComorosCongo, Dem. Rep.Congo, Rep.Costa RicaCote d'IvoireCroatiaCyprusCzech RepublicDenmarkDjiboutiDominicaDominican RepublicEarly-demographic dividendEast Asia & PacificEast Asia & Pacific (excluding high income)East Asia & Pacific (IDA & IBRD countries)EcuadorEgypt, Arab Rep.El SalvadorEquatorial GuineaEritreaEstoniaEthiopiaEuro areaEurope & Central AsiaEurope & Central Asia (excluding high income)Europe & Central Asia (IDA & IBRD countries)European UnionFaroe IslandsFijiFinlandFragile and conflict affected situationsFranceGabonGambia, TheGeorgiaGermanyGhanaGreeceGrenadaGuatemalaGuineaGuinea-BissauGuyanaHaitiHeavily indebted poor countries (HIPC)High incomeHondurasHong Kong SAR, ChinaHungaryIBRD onlyIcelandIDA & IBRD totalIDA blendIDA onlyIDA totalIndiaIndonesiaIran, Islamic Rep.IraqIrelandIsraelItalyJamaicaJapanJordanKazakhstanKenyaKiribatiKorea, Rep.KosovoKuwaitKyrgyz RepublicLao PDRLate-demographic dividendLatin America & Caribbean Latin America & Caribbean (excluding high income)Latin America & the Caribbean (IDA & IBRD countries)LatviaLeast developed countries: UN classificationLebanonLesothoLiberiaLibyaLithuaniaLow & middle incomeLow incomeLower middle incomeLuxembourgMacao SAR, ChinaMacedonia, FYRMadagascarMalawiMalaysiaMaldivesMaliMaltaMauritaniaMauritiusMexicoMiddle East & North AfricaMiddle East & North Africa (excluding high income)Middle East & North Africa (IDA & IBRD countries)Middle incomeMoldovaMongoliaMontenegroMoroccoMozambiqueNamibiaNepalNetherlandsNew ZealandNicaraguaNigerNigeriaNorth AmericaNorwayOECD membersOmanOther small statesPacific island small statesPakistanPanamaPapua New GuineaParaguayPeruPhilippinesPolandPortugalPost-demographic dividendPre-demographic dividendQatarRomaniaRussian FederationRwandaSaudi ArabiaSenegalSerbiaSeychellesSierra LeoneSingaporeSlovak RepublicSloveniaSmall statesSolomon IslandsSouth AfricaSouth AsiaSouth Asia (IDA & IBRD)South SudanSpainSri LankaSt. Kitts and NevisSt. LuciaSt. Vincent and the GrenadinesSub-Saharan Africa Sub-Saharan Africa (excluding high income)Sub-Saharan Africa (IDA & IBRD countries)SudanSurinameSwazilandSwedenSwitzerlandSyrian Arab RepublicTajikistanTanzaniaThailandTimor-LesteTogoTongaTrinidad and TobagoTunisiaTurkeyUgandaUkraineUnited KingdomUnited StatesUpper middle incomeUruguayVanuatuVenezuela, RBVietnamWest Bank and GazaWorldYemen, Rep.ZambiaZimbabwe Linha do tempo:
Nesta escala de tempo está apresentado um gráfico de 1980 ano até 2016 ano Small states. Dados de 1979 ano ausente. O número de observações reais por data: 34.
Fonte (nome):
Indicadores de desenvolvimento mundial
Fonte (organização):
World Bank national accounts data, and OECD National Accounts data files.
Categorias:
Economy & Growth
Foi atualizado:
23 abr 2017 ano
Indicadores de alterações dos valores ao longo dos anos
Mínimo:
20.37
1 jan 1987 ano
Máximo:
43.052
1 jan 2013 ano
Na data de observação
Valor
Mudança absoluta
A alteração em relação ao valor anterior
1 jan 1980 ano
26.419
+26.419
0.0%
1 jan 1981 ano
32.584
+6.164
23.33%
1 jan 1982 ano
29.921
-2.663
-8.17%
1 jan 1983 ano
24.909
-5.012
-16.75%
1 jan 1984 ano
22.756
-2.152
-8.64%
1 jan 1985 ano
23.934
+1.178
5.18%
1 jan 1986 ano
24.206
+0.271
1.13%
1 jan 1987 ano
20.37
-3.836
-15.85%
1 jan 1988 ano
21.04
+0.67
3.29%
1 jan 1989 ano
23.983
+2.943
13.99%
1 jan 1990 ano
23.068
-0.915
-3.82%
1 jan 1991 ano
23.718
+0.65
2.82%
1 jan 1992 ano
22.155
-1.563
-6.59%
1 jan 1993 ano
22.08
-0.075
-0.34%
1 jan 1994 ano
21.911
-0.169
-0.76%
1 jan 1995 ano
23.3
+1.389
6.34%
1 jan 1996 ano
24.332
+1.033
4.43%
1 jan 1997 ano
24.734
+0.401
1.65%
1 jan 1998 ano
22.866
-1.867
-7.55%
1 jan 1999 ano
22.616
-0.251
-1.1%
1 jan 2000 ano
21.844
-0.772
-3.41%
1 jan 2001 ano
24.393
+2.549
11.67%
1 jan 2002 ano
24.653
+0.26
1.07%
1 jan 2003 ano
24.078
-0.575
-2.33%
1 jan 2004 ano
25.229
+1.15
4.78%
1 jan 2005 ano
24.727
-0.502
-1.99%
1 jan 2006 ano
28.281
+3.555
14.38%
1 jan 2007 ano
29.725
+1.444
5.1%
1 jan 2008 ano
28.065
-1.66
-5.58%
1 jan 2012 ano
41.186
+13.12
46.75%
1 jan 2013 ano
43.052
+1.866
4.53%
1 jan 2014 ano
41.7
-1.351
-3.14%
1 jan 2015 ano
41.435
-0.265
-0.64%
1 jan 2016 ano
36.78
-4.656
-11.24%
Classificação de países por estatísticas atuais por anos


Comentários: