30
/pt/
AIzaSyAYiBZKx7MnpbEhh9jyipgxe19OcubqV5w
April 1, 2024
135595
Gabon
GAB
true
2
1
Gross savings (% of GNI)
2006,2005,2004,2003,2002,2001,2000,1999,1998,1997,1996,1995,1994,1993,1992,1991,1990,1989,1988,1987,1986,1985,1984,1983,1982,1981,1980,1979
Download
Biblioteca de estatísticas globais →Gabon →

Gross savings (% of GNI)

Estas estatísticas em outros países:

AfghanistanAlbaniaAlgeriaAngolaAntigua and BarbudaArab WorldArgentinaArmeniaAustraliaAustriaAzerbaijanBahamas, TheBahrainBangladeshBarbadosBelarusBelgiumBelizeBeninBermudaBhutanBoliviaBosnia and HerzegovinaBotswanaBrazilBrunei DarussalamBulgariaBurkina FasoBurundiCabo VerdeCambodiaCameroonCanadaCaribbean small statesCentral African RepublicCentral Europe and the BalticsChadChileChinaColombiaComorosCongo, Dem. Rep.Congo, Rep.Costa RicaCote d'IvoireCroatiaCyprusCzech RepublicDenmarkDjiboutiDominicaDominican RepublicEarly-demographic dividendEast Asia & PacificEast Asia & Pacific (excluding high income)East Asia & Pacific (IDA & IBRD countries)EcuadorEgypt, Arab Rep.El SalvadorEquatorial GuineaEritreaEstoniaEthiopiaEuro areaEurope & Central AsiaEurope & Central Asia (excluding high income)Europe & Central Asia (IDA & IBRD countries)European UnionFaroe IslandsFijiFinlandFragile and conflict affected situationsFranceGabonGambia, TheGeorgiaGermanyGhanaGreeceGrenadaGuatemalaGuineaGuinea-BissauGuyanaHaitiHeavily indebted poor countries (HIPC)High incomeHondurasHong Kong SAR, ChinaHungaryIBRD onlyIcelandIDA & IBRD totalIDA blendIDA onlyIDA totalIndiaIndonesiaIran, Islamic Rep.IraqIrelandIsraelItalyJamaicaJapanJordanKazakhstanKenyaKiribatiKorea, Rep.KosovoKuwaitKyrgyz RepublicLao PDRLate-demographic dividendLatin America & Caribbean Latin America & Caribbean (excluding high income)Latin America & the Caribbean (IDA & IBRD countries)LatviaLeast developed countries: UN classificationLebanonLesothoLiberiaLibyaLithuaniaLow & middle incomeLow incomeLower middle incomeLuxembourgMacao SAR, ChinaMacedonia, FYRMadagascarMalawiMalaysiaMaldivesMaliMaltaMauritaniaMauritiusMexicoMiddle East & North AfricaMiddle East & North Africa (excluding high income)Middle East & North Africa (IDA & IBRD countries)Middle incomeMoldovaMongoliaMontenegroMoroccoMozambiqueNamibiaNepalNetherlandsNew ZealandNicaraguaNigerNigeriaNorth AmericaNorwayOECD membersOmanOther small statesPacific island small statesPakistanPanamaPapua New GuineaParaguayPeruPhilippinesPolandPortugalPost-demographic dividendPre-demographic dividendQatarRomaniaRussian FederationRwandaSaudi ArabiaSenegalSerbiaSeychellesSierra LeoneSingaporeSlovak RepublicSloveniaSmall statesSolomon IslandsSouth AfricaSouth AsiaSouth Asia (IDA & IBRD)South SudanSpainSri LankaSt. Kitts and NevisSt. LuciaSt. Vincent and the GrenadinesSub-Saharan Africa Sub-Saharan Africa (excluding high income)Sub-Saharan Africa (IDA & IBRD countries)SudanSurinameSwazilandSwedenSwitzerlandSyrian Arab RepublicTajikistanTanzaniaThailandTimor-LesteTogoTongaTrinidad and TobagoTunisiaTurkeyUgandaUkraineUnited KingdomUnited StatesUpper middle incomeUruguayVanuatuVenezuela, RBVietnamWest Bank and GazaWorldYemen, Rep.ZambiaZimbabwe

Linha do tempo:

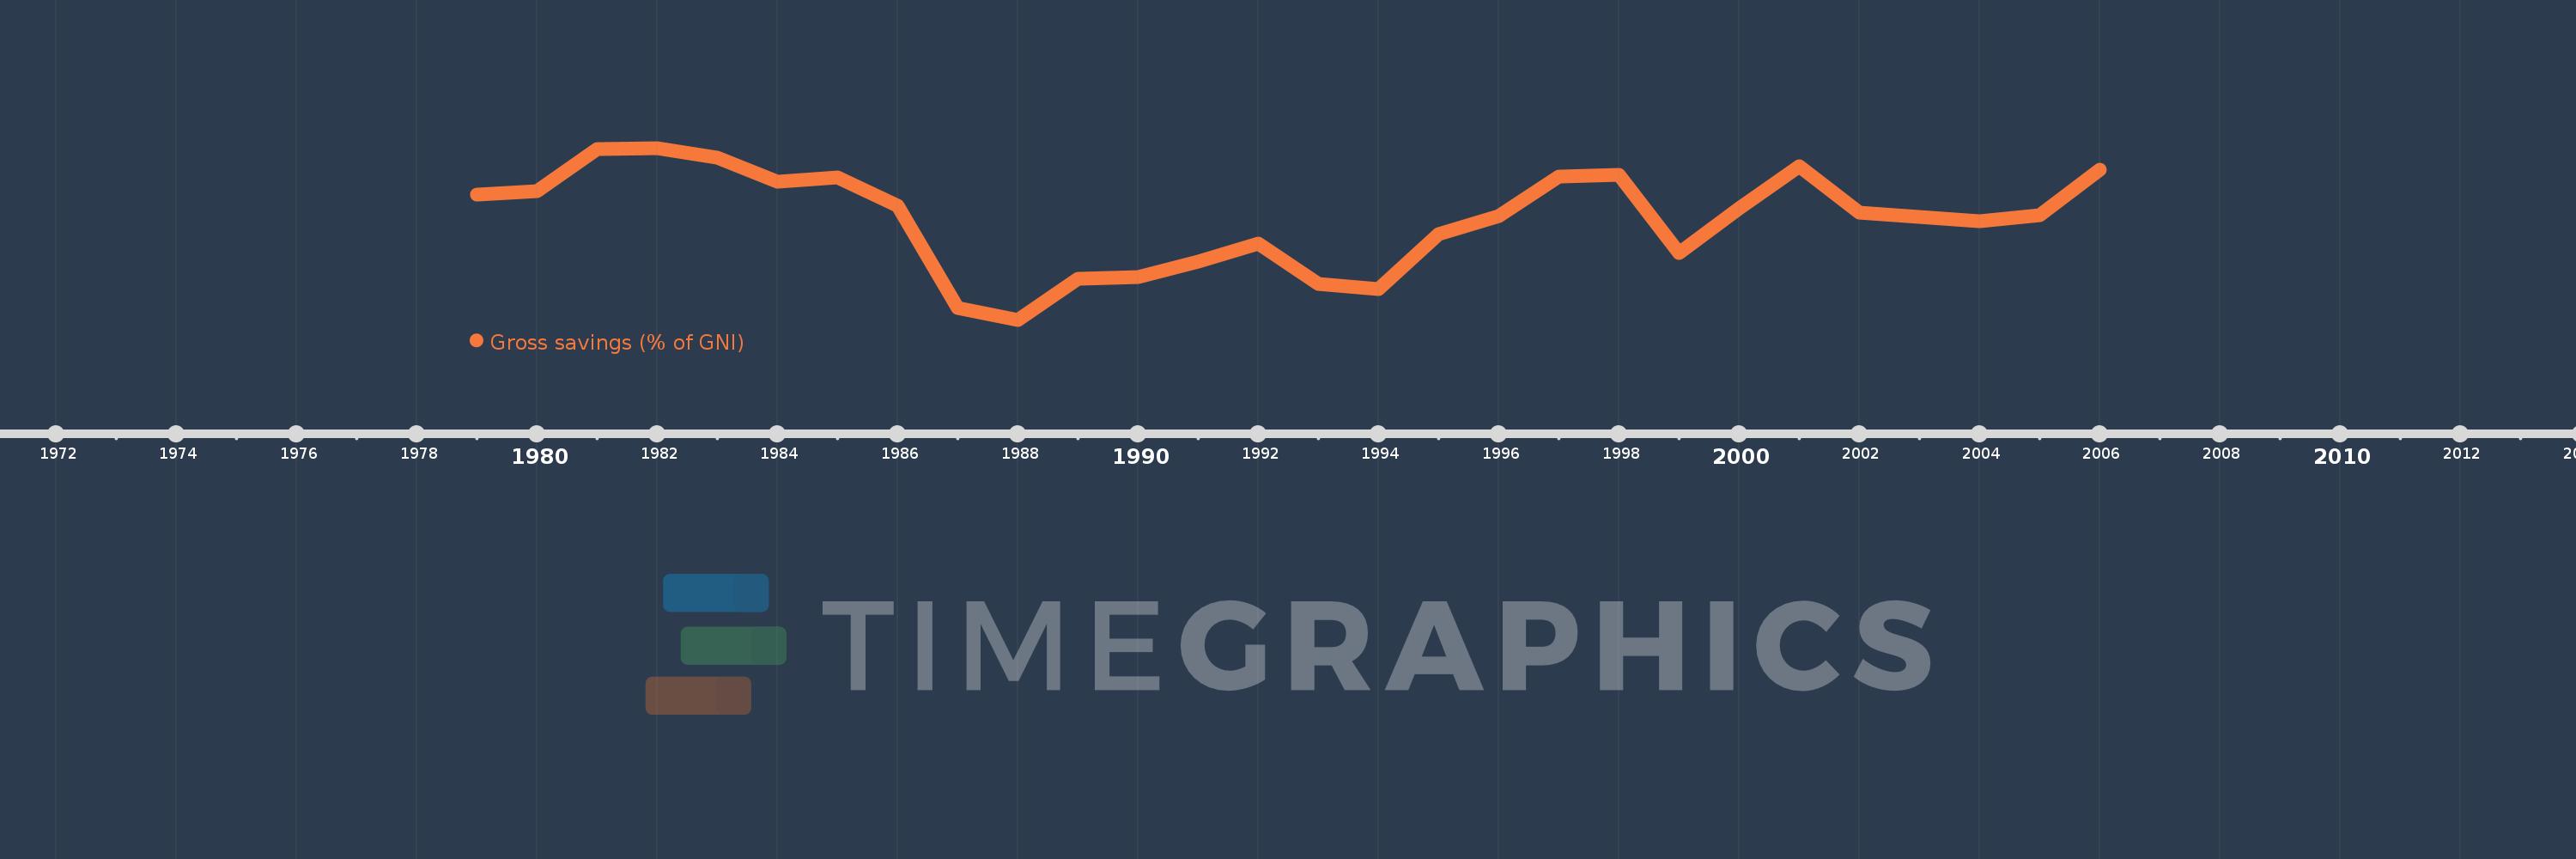
Nesta escala de tempo está apresentado um gráfico de 1979 ano até 2006 ano Gabon. Dados de 1978 ano ausente. O número de observações reais por data: 28.

Fonte (nome):

Indicadores de desenvolvimento mundial

Fonte (organização):

World Bank national accounts data, and OECD National Accounts data files.

Categorias:

Economy & Growth

Foi atualizado:

23 abr 2017 ano

Indicadores de alterações dos valores ao longo dos anos

Em média:
36.958
Mínimo:
13.689
1 jan 1988 ano
Máximo:
53.374
1 jan 1982 ano
Na data de observação
Valor
Mudança absoluta
A alteração em relação ao valor anterior
1 jan 1979 ano
42.633
+42.633
0.0%
1 jan 1980 ano
43.352
+0.719
1.69%
1 jan 1981 ano
53.086
+9.734
22.45%
1 jan 1982 ano
53.374
+0.288
0.54%
1 jan 1983 ano
51.072
-2.302
-4.31%
1 jan 1984 ano
45.597
-5.475
-10.72%
1 jan 1985 ano
46.614
+1.017
2.23%
1 jan 1986 ano
40.047
-6.567
-14.09%
1 jan 1987 ano
16.487
-23.56
-58.83%
1 jan 1988 ano
13.689
-2.798
-16.97%
1 jan 1989 ano
23.082
+9.393
68.62%
1 jan 1990 ano
23.615
+0.534
2.31%
1 jan 1991 ano
27.051
+3.436
14.55%
1 jan 1992 ano
31.191
+4.139
15.3%
1 jan 1993 ano
22.015
-9.176
-29.42%
1 jan 1994 ano
20.855
-1.16
-5.27%
1 jan 1995 ano
33.417
+12.562
60.23%
1 jan 1996 ano
37.734
+4.317
12.92%
1 jan 1997 ano
46.716
+8.981
23.8%
1 jan 1998 ano
47.067
+0.352
0.75%
1 jan 1999 ano
29.052
-18.015
-38.27%
1 jan 2000 ano
39.34
+10.288
35.41%
1 jan 2001 ano
49.217
+9.876
25.1%
1 jan 2002 ano
38.371
-10.845
-22.04%
1 jan 2003 ano
37.458
-0.914
-2.38%
1 jan 2004 ano
36.432
-1.025
-2.74%
1 jan 2005 ano
37.899
+1.467
4.03%
1 jan 2006 ano
48.366
+10.467
27.62%

Classificação de países por estatísticas atuais por anos