30
/pt/
AIzaSyAYiBZKx7MnpbEhh9jyipgxe19OcubqV5w
April 1, 2024
255252
Swaziland
SWZ
true
2
1
Gross savings (% of GNI)
2015,2014,2013,2012,2011,2010,2009,2008,2007,2006,2005,2004,2003,2002,2001,2000,1999,1998,1997,1996,1995,1994,1993,1992,1991,1975
Download
Biblioteca de estatísticas globais →Swaziland →

Gross savings (% of GNI)

Estas estatísticas em outros países:

AfghanistanAlbaniaAlgeriaAngolaAntigua and BarbudaArab WorldArgentinaArmeniaAustraliaAustriaAzerbaijanBahamas, TheBahrainBangladeshBarbadosBelarusBelgiumBelizeBeninBermudaBhutanBoliviaBosnia and HerzegovinaBotswanaBrazilBrunei DarussalamBulgariaBurkina FasoBurundiCabo VerdeCambodiaCameroonCanadaCaribbean small statesCentral African RepublicCentral Europe and the BalticsChadChileChinaColombiaComorosCongo, Dem. Rep.Congo, Rep.Costa RicaCote d'IvoireCroatiaCyprusCzech RepublicDenmarkDjiboutiDominicaDominican RepublicEarly-demographic dividendEast Asia & PacificEast Asia & Pacific (excluding high income)East Asia & Pacific (IDA & IBRD countries)EcuadorEgypt, Arab Rep.El SalvadorEquatorial GuineaEritreaEstoniaEthiopiaEuro areaEurope & Central AsiaEurope & Central Asia (excluding high income)Europe & Central Asia (IDA & IBRD countries)European UnionFaroe IslandsFijiFinlandFragile and conflict affected situationsFranceGabonGambia, TheGeorgiaGermanyGhanaGreeceGrenadaGuatemalaGuineaGuinea-BissauGuyanaHaitiHeavily indebted poor countries (HIPC)High incomeHondurasHong Kong SAR, ChinaHungaryIBRD onlyIcelandIDA & IBRD totalIDA blendIDA onlyIDA totalIndiaIndonesiaIran, Islamic Rep.IraqIrelandIsraelItalyJamaicaJapanJordanKazakhstanKenyaKiribatiKorea, Rep.KosovoKuwaitKyrgyz RepublicLao PDRLate-demographic dividendLatin America & Caribbean Latin America & Caribbean (excluding high income)Latin America & the Caribbean (IDA & IBRD countries)LatviaLeast developed countries: UN classificationLebanonLesothoLiberiaLibyaLithuaniaLow & middle incomeLow incomeLower middle incomeLuxembourgMacao SAR, ChinaMacedonia, FYRMadagascarMalawiMalaysiaMaldivesMaliMaltaMauritaniaMauritiusMexicoMiddle East & North AfricaMiddle East & North Africa (excluding high income)Middle East & North Africa (IDA & IBRD countries)Middle incomeMoldovaMongoliaMontenegroMoroccoMozambiqueNamibiaNepalNetherlandsNew ZealandNicaraguaNigerNigeriaNorth AmericaNorwayOECD membersOmanOther small statesPacific island small statesPakistanPanamaPapua New GuineaParaguayPeruPhilippinesPolandPortugalPost-demographic dividendPre-demographic dividendQatarRomaniaRussian FederationRwandaSaudi ArabiaSenegalSerbiaSeychellesSierra LeoneSingaporeSlovak RepublicSloveniaSmall statesSolomon IslandsSouth AfricaSouth AsiaSouth Asia (IDA & IBRD)South SudanSpainSri LankaSt. Kitts and NevisSt. LuciaSt. Vincent and the GrenadinesSub-Saharan Africa Sub-Saharan Africa (excluding high income)Sub-Saharan Africa (IDA & IBRD countries)SudanSurinameSwazilandSwedenSwitzerlandSyrian Arab RepublicTajikistanTanzaniaThailandTimor-LesteTogoTongaTrinidad and TobagoTunisiaTurkeyUgandaUkraineUnited KingdomUnited StatesUpper middle incomeUruguayVanuatuVenezuela, RBVietnamWest Bank and GazaWorldYemen, Rep.ZambiaZimbabwe

Linha do tempo:

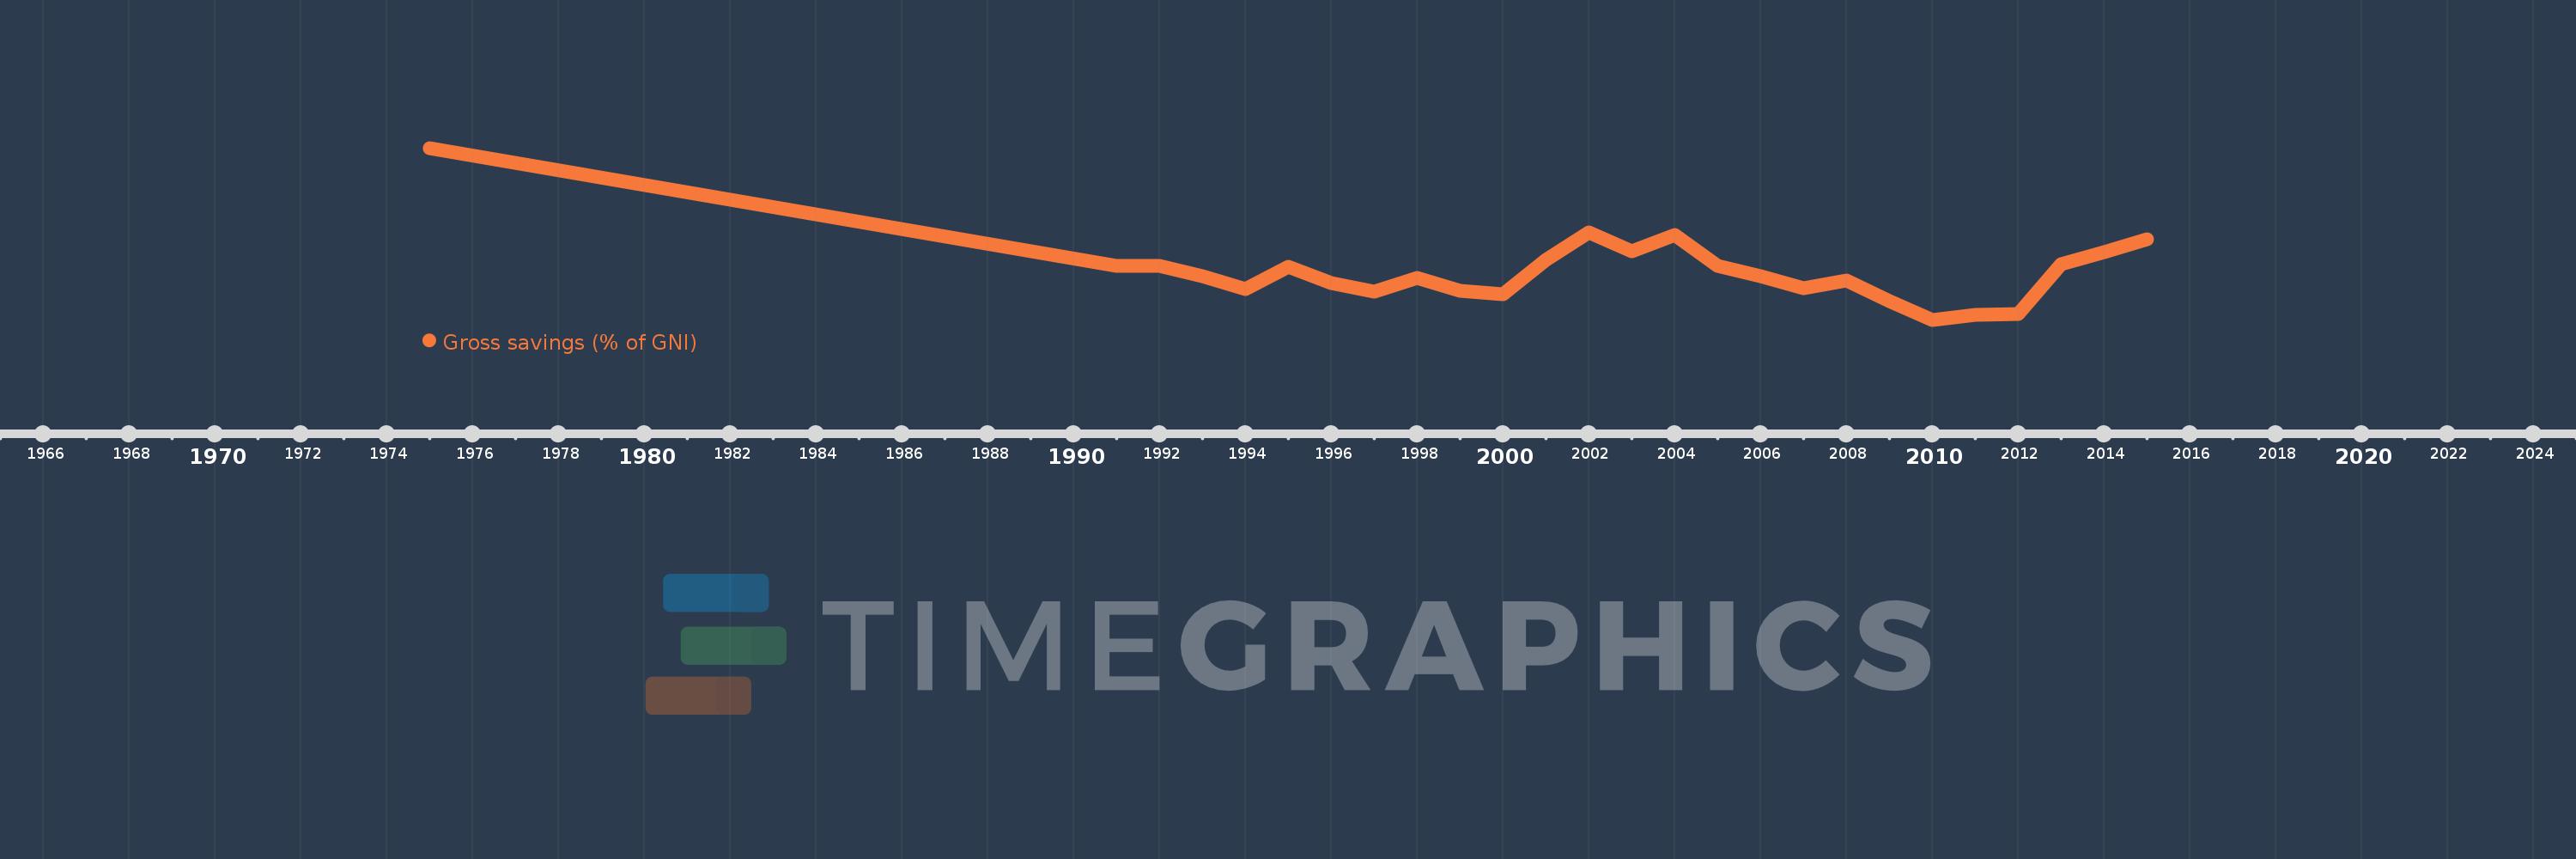
Nesta escala de tempo está apresentado um gráfico de 1975 ano até 2015 ano Swaziland. Dados de 1974 ano ausente. O número de observações reais por data: 26.

Fonte (nome):

Indicadores de desenvolvimento mundial

Fonte (organização):

World Bank national accounts data, and OECD National Accounts data files.

Categorias:

Economy & Growth

Foi atualizado:

23 abr 2017 ano

Indicadores de alterações dos valores ao longo dos anos

Em média:
17.473
Mínimo:
6.597
1 jan 2010 ano
Máximo:
44.835
1 jan 1975 ano
Na data de observação
Valor
Mudança absoluta
A alteração em relação ao valor anterior
1 jan 1975 ano
44.835
+44.835
0.0%
1 jan 1991 ano
18.676
-26.159
-58.34%
1 jan 1992 ano
18.605
-0.071
-0.38%
1 jan 1993 ano
16.314
-2.291
-12.32%
1 jan 1994 ano
13.503
-2.81
-17.23%
1 jan 1995 ano
18.314
+4.811
35.63%
1 jan 1996 ano
14.803
-3.511
-19.17%
1 jan 1997 ano
12.903
-1.9
-12.84%
1 jan 1998 ano
15.953
+3.05
23.64%
1 jan 1999 ano
13.039
-2.914
-18.26%
1 jan 2000 ano
12.315
-0.725
-5.56%
1 jan 2001 ano
19.893
+7.578
61.54%
1 jan 2002 ano
25.959
+6.066
30.5%
1 jan 2003 ano
21.745
-4.214
-16.23%
1 jan 2004 ano
25.46
+3.715
17.08%
1 jan 2005 ano
18.549
-6.911
-27.15%
1 jan 2006 ano
16.324
-2.225
-12.0%
1 jan 2007 ano
13.591
-2.732
-16.74%
1 jan 2008 ano
15.315
+1.723
12.68%
1 jan 2009 ano
10.735
-4.58
-29.91%
1 jan 2010 ano
6.597
-4.138
-38.55%
1 jan 2011 ano
7.696
+1.099
16.66%
1 jan 2012 ano
7.935
+0.239
3.11%
1 jan 2013 ano
19.006
+11.071
139.53%
1 jan 2014 ano
21.687
+2.681
14.1%
1 jan 2015 ano
24.555
+2.868
13.22%

Classificação de países por estatísticas atuais por anos