29
/pt/
pt
AIzaSyAYiBZKx7MnpbEhh9jyipgxe19OcubqV5w
April 1, 2024
54970
Post-demographic dividend
PST
false
2
1
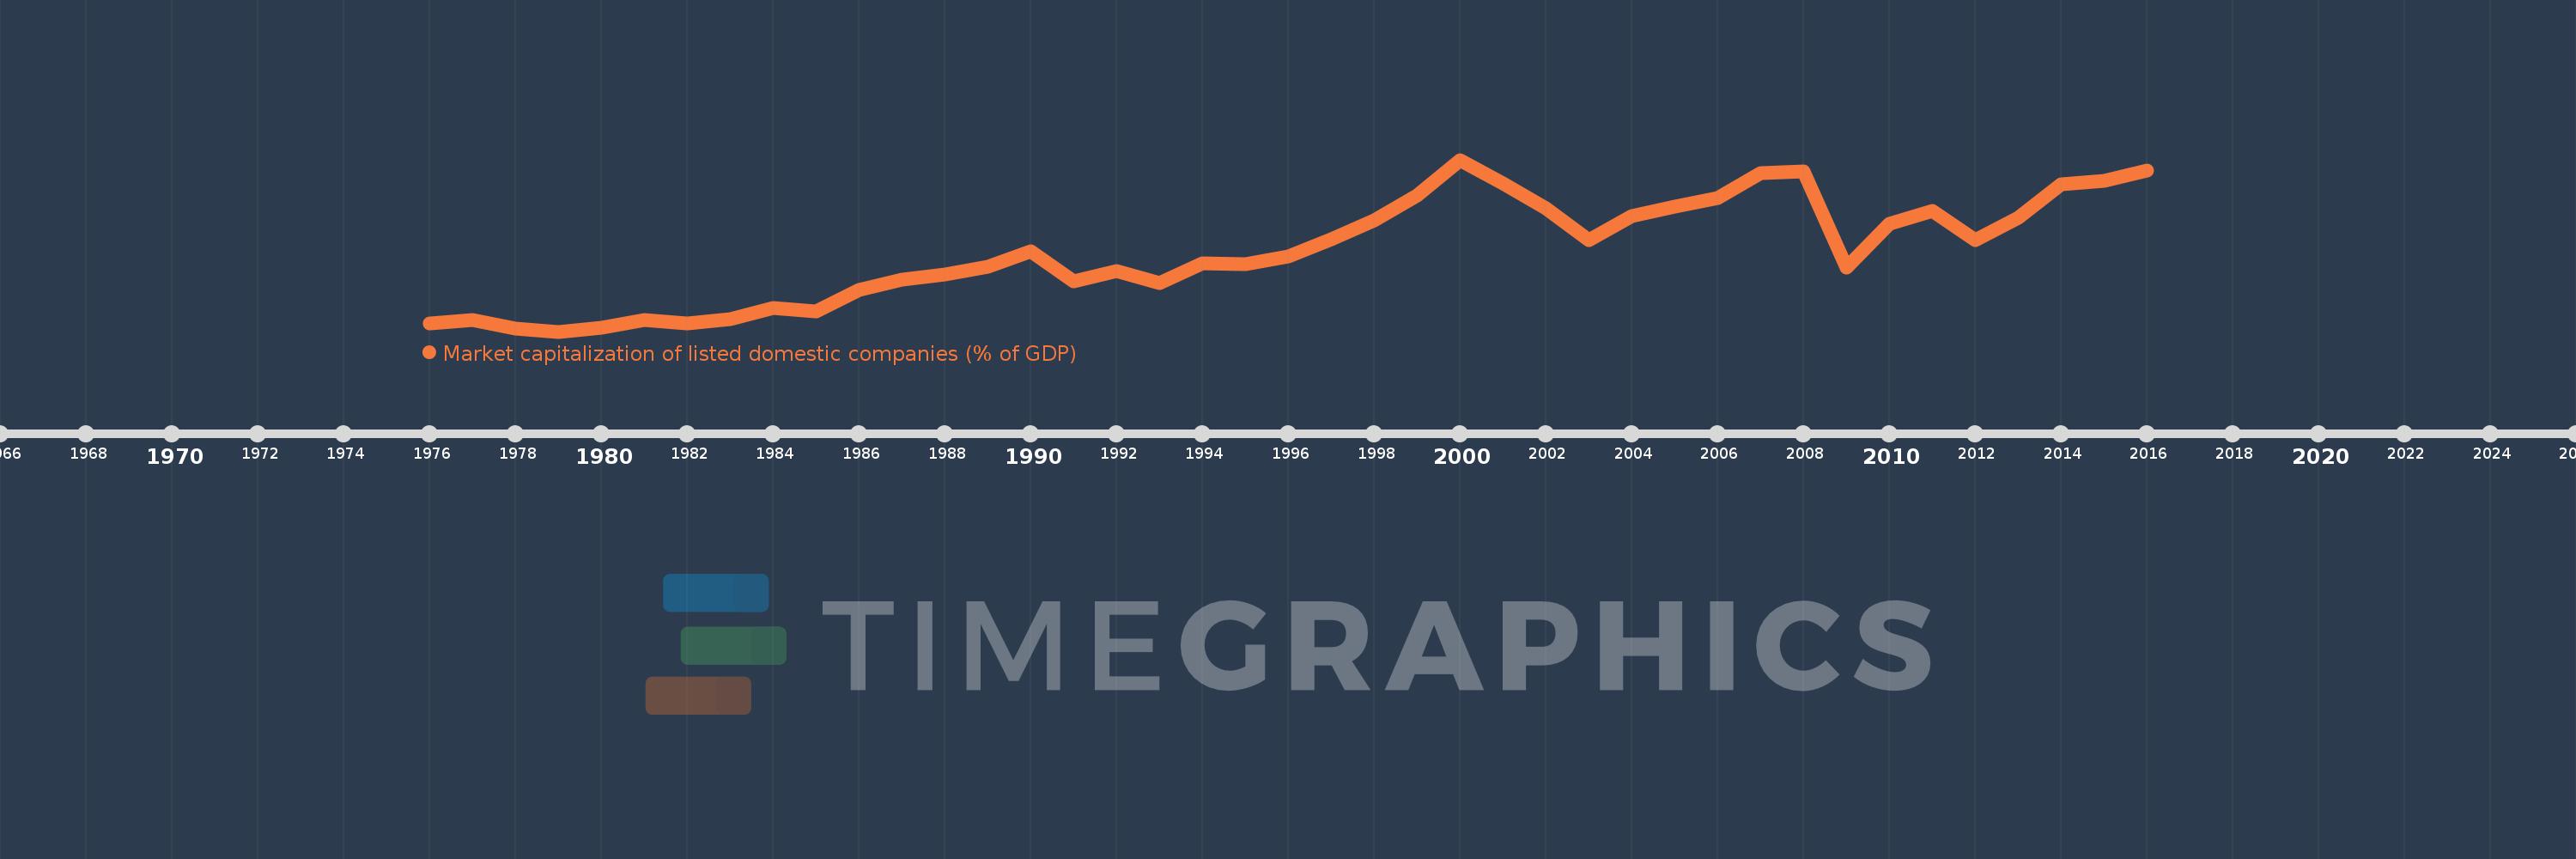
Market capitalization of listed domestic companies (% of GDP)
2016,2015,2014,2013,2012,2011,2010,2009,2008,2007,2006,2005,2004,2003,2002,2001,2000,1999,1998,1997,1996,1995,1994,1993,1992,1991,1990,1989,1988,1987,1986,1985,1984,1983,1982,1981,1980,1979,1978,1977,1976
Estas estatísticas em outros países:
Linha do tempo:
Nesta escala de tempo está apresentado um gráfico de 1976 ano até 2016 ano Post-demographic dividend. Dados de 1975 ano ausente. O número de observações reais por data: 41.
Fonte (nome):
Indicadores de desenvolvimento mundial
Fonte (organização):
World Federation of Exchanges database.
Categorias:
Financial Sector
Foi atualizado:
23 abr 2017 ano
Indicadores de alterações dos valores ao longo dos anos
Mínimo:
25.003
1 jan 1979 ano
Máximo:
128.386
1 jan 2000 ano
Na data de observação
Valor
Mudança absoluta
A alteração em relação ao valor anterior
1 jan 1976 ano
29.971
+29.971
0.0%
1 jan 1977 ano
31.861
+1.89
6.31%
1 jan 1978 ano
26.814
-5.047
-15.84%
1 jan 1979 ano
25.003
-1.81
-6.75%
1 jan 1980 ano
27.166
+2.162
8.65%
1 jan 1981 ano
31.954
+4.789
17.63%
1 jan 1982 ano
29.699
-2.256
-7.06%
1 jan 1983 ano
32.714
+3.015
10.15%
1 jan 1984 ano
39.172
+6.458
19.74%
1 jan 1985 ano
37.043
-2.129
-5.44%
1 jan 1986 ano
49.907
+12.865
34.73%
1 jan 1987 ano
56.37
+6.463
12.95%
1 jan 1988 ano
59.138
+2.768
4.91%
1 jan 1989 ano
64.229
+5.091
8.61%
1 jan 1990 ano
73.264
+9.035
14.07%
1 jan 1991 ano
55.108
-18.156
-24.78%
1 jan 1992 ano
61.345
+6.237
11.32%
1 jan 1993 ano
54.09
-7.255
-11.83%
1 jan 1994 ano
65.939
+11.848
21.9%
1 jan 1995 ano
65.394
-0.545
-0.83%
1 jan 1996 ano
70.407
+5.013
7.67%
1 jan 1997 ano
80.578
+10.172
14.45%
1 jan 1998 ano
92.149
+11.571
14.36%
1 jan 1999 ano
106.942
+14.793
16.05%
1 jan 2000 ano
128.386
+21.444
20.05%
1 jan 2001 ano
114.124
-14.263
-11.11%
1 jan 2002 ano
98.999
-15.125
-13.25%
1 jan 2003 ano
79.866
-19.133
-19.33%
1 jan 2004 ano
94.484
+14.618
18.3%
1 jan 2005 ano
100.235
+5.751
6.09%
1 jan 2006 ano
105.286
+5.051
5.04%
1 jan 2007 ano
120.521
+15.235
14.47%
1 jan 2008 ano
121.206
+0.685
0.57%
1 jan 2009 ano
63.745
-57.461
-47.41%
1 jan 2010 ano
90.011
+26.265
41.2%
1 jan 2011 ano
97.432
+7.422
8.25%
1 jan 2012 ano
79.801
-17.631
-18.1%
1 jan 2013 ano
93.276
+13.475
16.89%
1 jan 2014 ano
113.901
+20.625
22.11%
1 jan 2015 ano
115.629
+1.728
1.52%
1 jan 2016 ano
121.747
+6.118
5.29%
Classificação de países por estatísticas atuais por anos


Comentários: