29
/pt/
pt
AIzaSyAYiBZKx7MnpbEhh9jyipgxe19OcubqV5w
April 1, 2024
188060
Malaysia
MYS
true
2
1
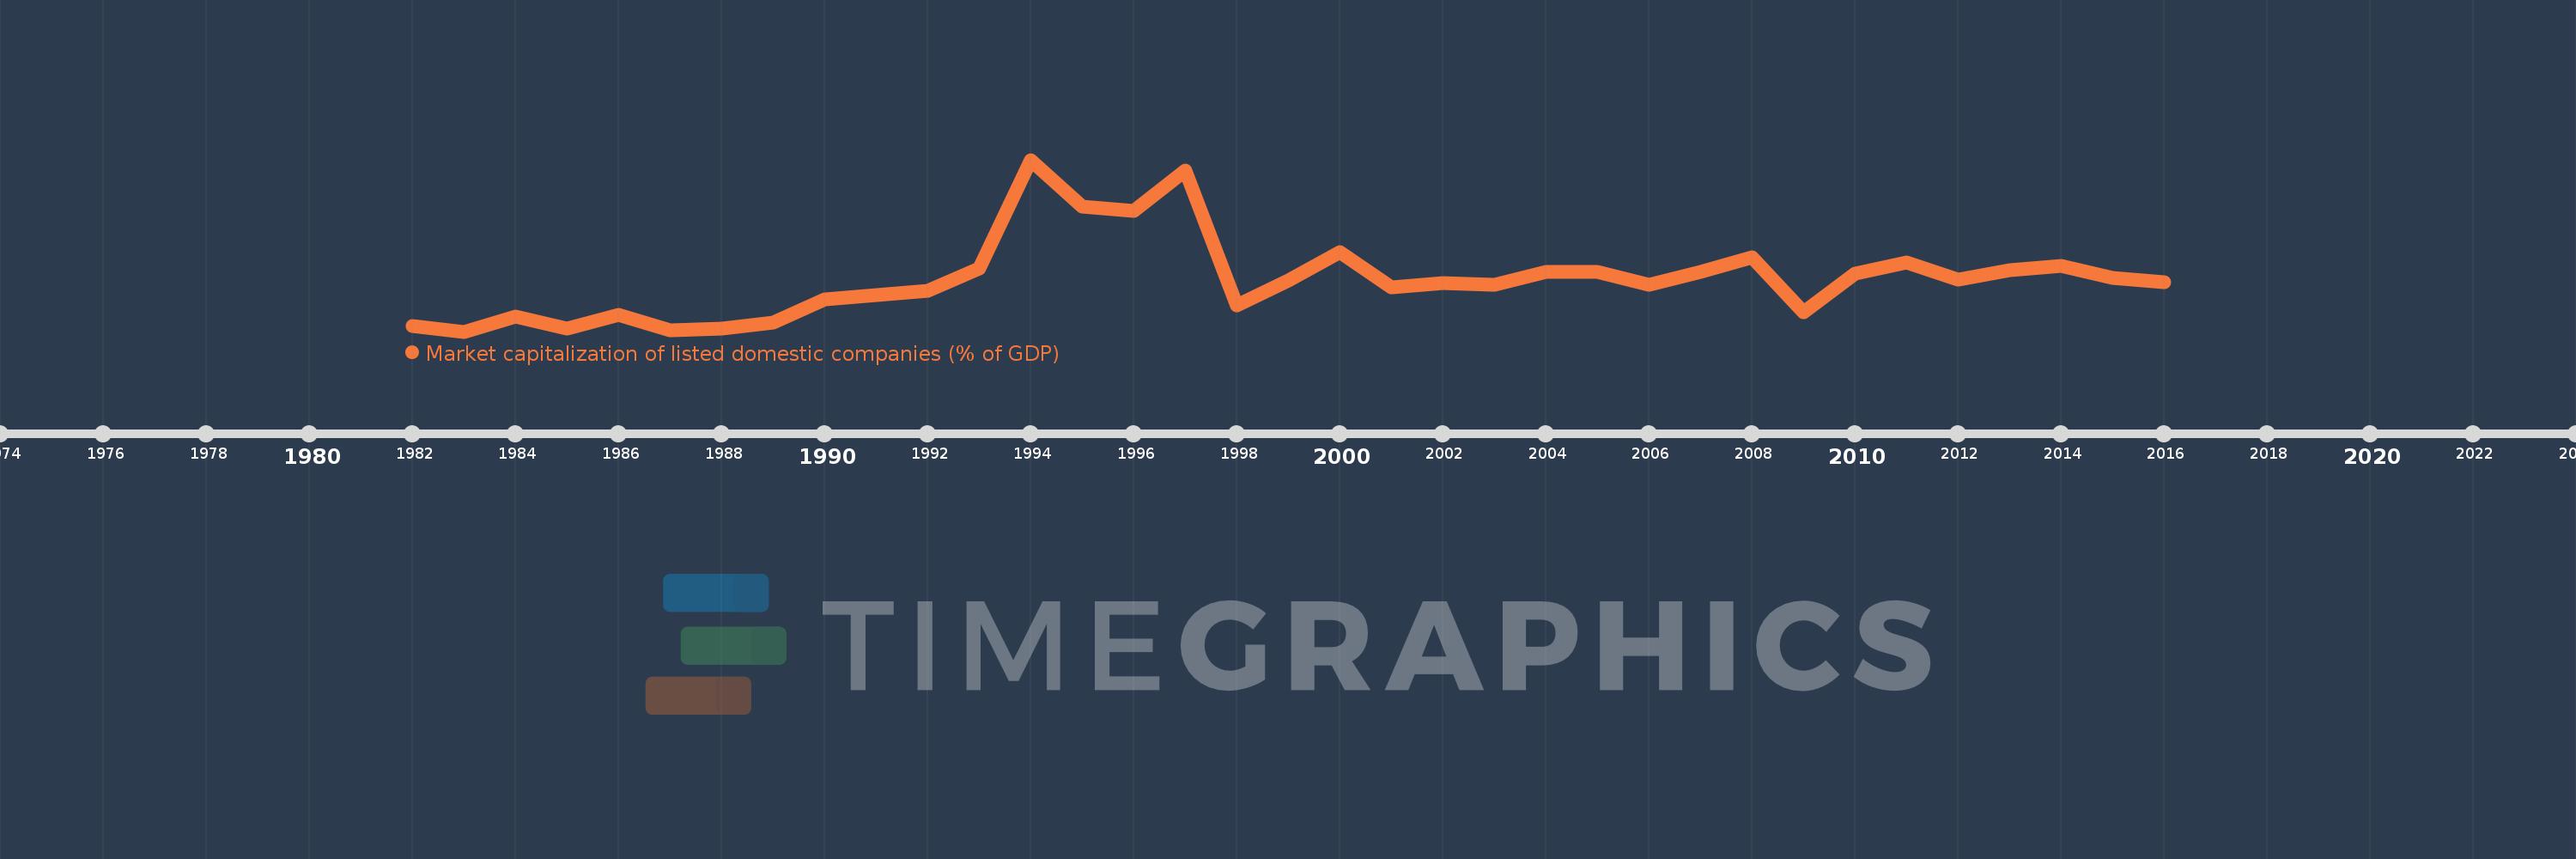
Market capitalization of listed domestic companies (% of GDP)
2016,2015,2014,2013,2012,2011,2010,2009,2008,2007,2006,2005,2004,2003,2002,2001,2000,1999,1998,1997,1996,1995,1994,1993,1992,1991,1990,1989,1988,1987,1986,1985,1984,1983,1982
Estas estatísticas em outros países:
Linha do tempo:
Nesta escala de tempo está apresentado um gráfico de 1982 ano até 2016 ano Malaysia. Dados de 1981 ano ausente. O número de observações reais por data: 35.
Fonte (nome):
Indicadores de desenvolvimento mundial
Fonte (organização):
World Federation of Exchanges database.
Categorias:
Financial Sector
Foi atualizado:
23 abr 2017 ano
Indicadores de alterações dos valores ao longo dos anos
Mínimo:
51.774
1 jan 1983 ano
Máximo:
320.993
1 jan 1994 ano
Na data de observação
Valor
Mudança absoluta
A alteração em relação ao valor anterior
1 jan 1982 ano
61.183
+61.183
0.0%
1 jan 1983 ano
51.774
-9.41
-15.38%
1 jan 1984 ano
74.799
+23.025
44.47%
1 jan 1985 ano
56.958
-17.841
-23.85%
1 jan 1986 ano
77.416
+20.458
35.92%
1 jan 1987 ano
53.584
-23.832
-30.78%
1 jan 1988 ano
56.717
+3.133
5.85%
1 jan 1989 ano
65.367
+8.65
15.25%
1 jan 1990 ano
102.182
+36.815
56.32%
1 jan 1991 ano
108.733
+6.551
6.41%
1 jan 1992 ano
115.421
+6.688
6.15%
1 jan 1993 ano
150.435
+35.014
30.34%
1 jan 1994 ano
320.993
+170.558
113.38%
1 jan 1995 ano
247.084
-73.909
-23.03%
1 jan 1996 ano
240.974
-6.111
-2.47%
1 jan 1997 ano
303.569
+62.595
25.98%
1 jan 1998 ano
93.225
-210.343
-69.29%
1 jan 1999 ano
132.416
+39.19
42.04%
1 jan 2000 ano
176.765
+44.35
33.49%
1 jan 2001 ano
120.648
-56.117
-31.75%
1 jan 2002 ano
128.234
+7.586
6.29%
1 jan 2003 ano
124.724
-3.51
-2.74%
1 jan 2004 ano
145.926
+21.202
17.0%
1 jan 2005 ano
145.591
-0.336
-0.23%
1 jan 2006 ano
125.766
-19.824
-13.62%
1 jan 2007 ano
144.803
+19.036
15.14%
1 jan 2008 ano
168.067
+23.264
16.07%
1 jan 2009 ano
81.988
-86.079
-51.22%
1 jan 2010 ano
142.996
+61.008
74.41%
1 jan 2011 ano
160.26
+17.264
12.07%
1 jan 2012 ano
132.781
-27.479
-17.15%
1 jan 2013 ano
148.386
+15.604
11.75%
1 jan 2014 ano
154.786
+6.401
4.31%
1 jan 2015 ano
135.772
-19.014
-12.28%
1 jan 2016 ano
129.26
-6.512
-4.8%
Classificação de países por estatísticas atuais por anos


Comentários: