30
/pt/
AIzaSyAYiBZKx7MnpbEhh9jyipgxe19OcubqV5w
April 1, 2024
225100
Poland
POL
true
2
1
Market capitalization of listed domestic companies (% of GDP)
2016,2015,2014,2013,2012,2011,2010,2009,2008,2007,2006,2005,2004,2003,2002,2001,2000,1999,1998,1997,1996
Download
Biblioteca de estatísticas globais →Poland →

Market capitalization of listed domestic companies (% of GDP)

Estas estatísticas em outros países:

Arab WorldArgentinaArmeniaAustraliaAustriaAzerbaijanBahrainBangladeshBarbadosBelgiumBermudaBhutanBoliviaBosnia and HerzegovinaBotswanaBrazilBulgariaCanadaCayman IslandsCentral Europe and the BalticsChannel IslandsChileChinaColombiaCosta RicaCote d'IvoireCroatiaCyprusCzech RepublicDenmarkDominican RepublicEarly-demographic dividendEast Asia & PacificEast Asia & Pacific (excluding high income)East Asia & Pacific (IDA & IBRD countries)EcuadorEgypt, Arab Rep.El SalvadorEuro areaEurope & Central AsiaEurope & Central Asia (excluding high income)Europe & Central Asia (IDA & IBRD countries)European UnionFijiFinlandFranceGeorgiaGermanyGhanaGreeceGuyanaHigh incomeHondurasHong Kong SAR, ChinaHungaryIBRD onlyIDA & IBRD totalIDA blendIndiaIndonesiaIran, Islamic Rep.IrelandIsraelItalyJamaicaJapanJordanKazakhstanKenyaKorea, Rep.KuwaitKyrgyz RepublicLate-demographic dividendLatin America & Caribbean Latin America & Caribbean (excluding high income)Latin America & the Caribbean (IDA & IBRD countries)LebanonLow & middle incomeLower middle incomeLuxembourgMacedonia, FYRMalawiMalaysiaMaltaMauritiusMexicoMiddle East & North AfricaMiddle East & North Africa (excluding high income)Middle East & North Africa (IDA & IBRD countries)Middle incomeMoldovaMongoliaMontenegroMoroccoNamibiaNetherlandsNew ZealandNigeriaNorth AmericaNorwayOECD membersOmanPakistanPanamaPapua New GuineaParaguayPeruPhilippinesPolandPortugalPost-demographic dividendQatarRomaniaRussian FederationSaudi ArabiaSerbiaSingaporeSlovak RepublicSloveniaSouth AfricaSouth AsiaSouth Asia (IDA & IBRD)SpainSri LankaSt. Kitts and NevisSub-Saharan Africa Sub-Saharan Africa (excluding high income)Sub-Saharan Africa (IDA & IBRD countries)SwazilandSwedenSwitzerlandTanzaniaThailandTrinidad and TobagoTunisiaTurkeyUgandaUkraineUnited Arab EmiratesUnited KingdomUnited StatesUpper middle incomeUruguayUzbekistanVenezuela, RBVietnamWest Bank and GazaWorldZambiaZimbabwe

Linha do tempo:

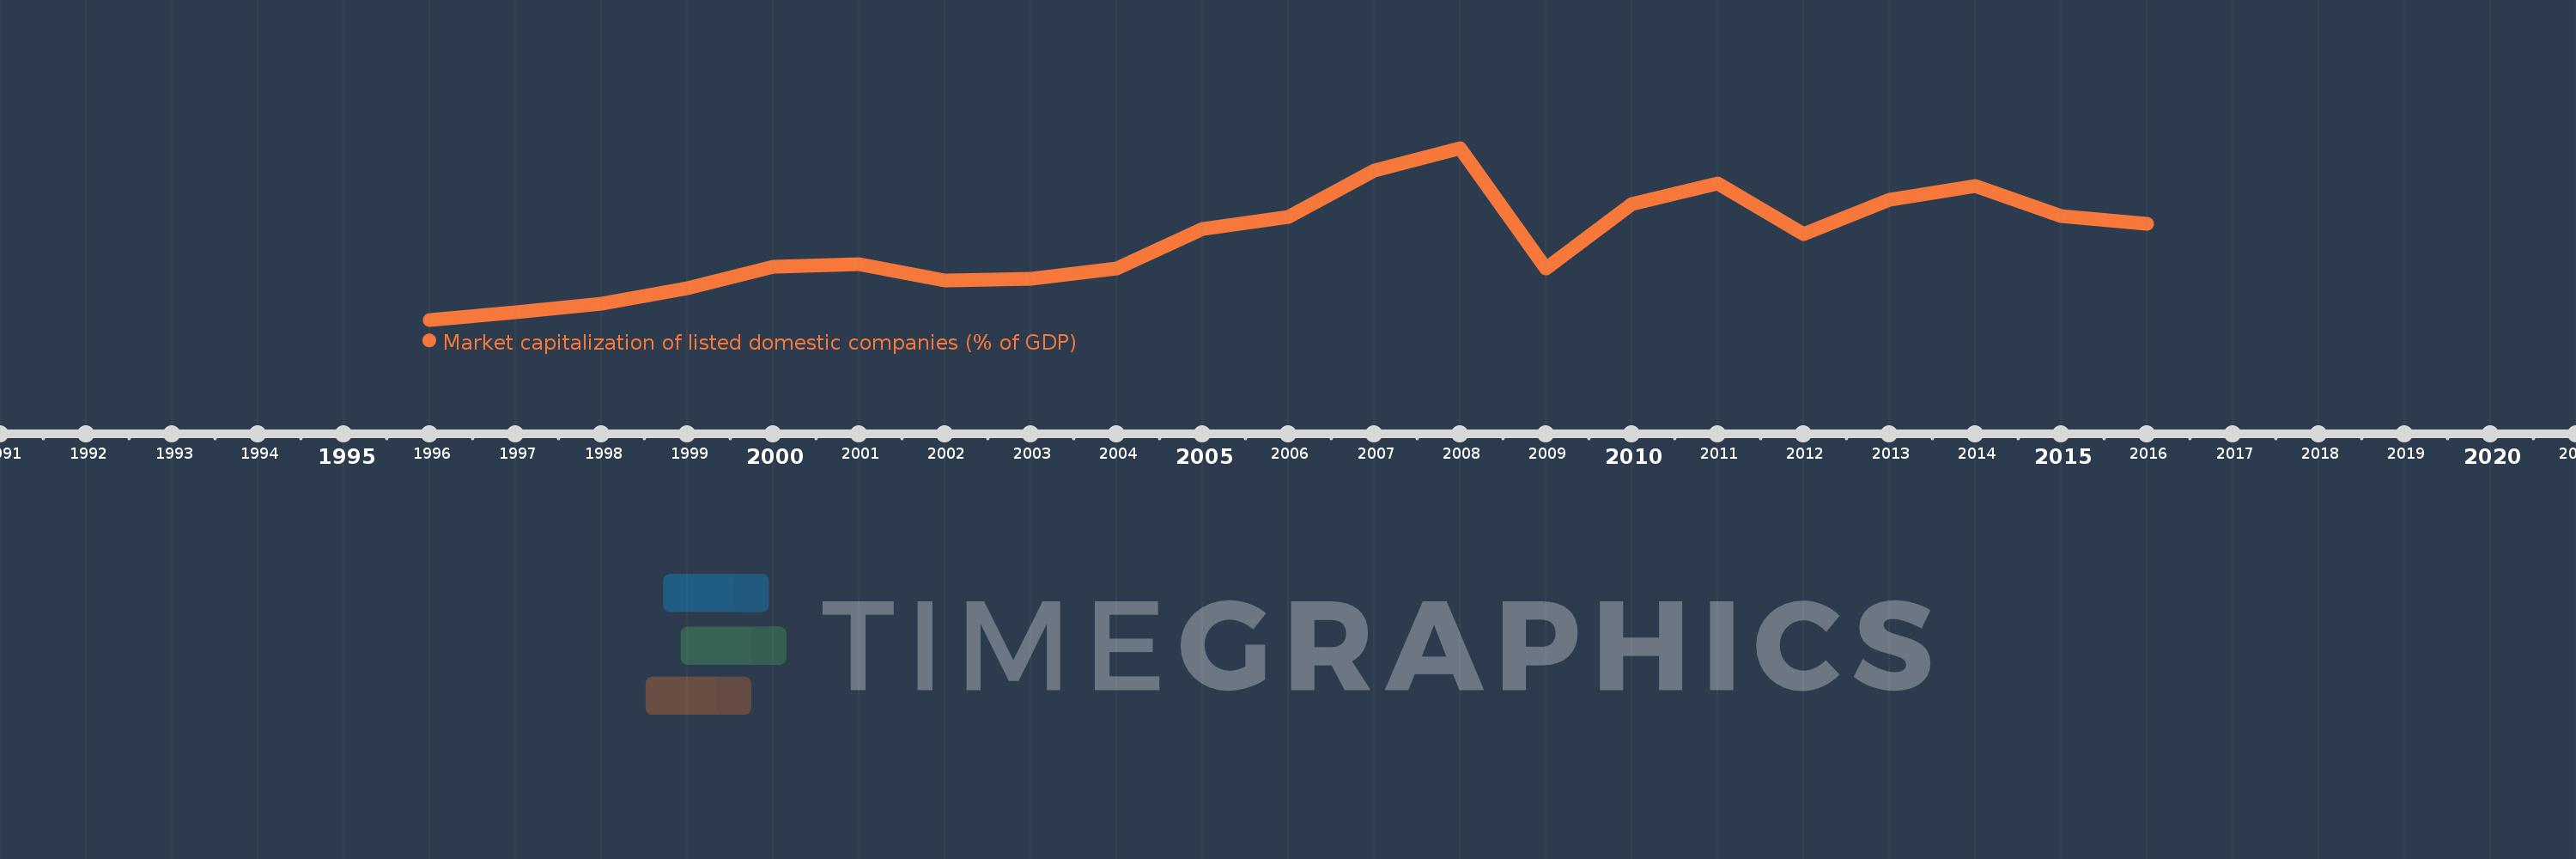
Nesta escala de tempo está apresentado um gráfico de 1996 ano até 2016 ano Poland. Dados de 1995 ano ausente. O número de observações reais por data: 21.

Fonte (nome):

Indicadores de desenvolvimento mundial

Fonte (organização):

World Federation of Exchanges database.

Categorias:

Financial Sector

Foi atualizado:

23 abr 2017 ano

Indicadores de alterações dos valores ao longo dos anos

Em média:
24.325
Mínimo:
3.211
1 jan 1996 ano
Máximo:
49.3
1 jan 2008 ano
Na data de observação
Valor
Mudança absoluta
A alteração em relação ao valor anterior
1 jan 1996 ano
3.211
+3.211
0.0%
1 jan 1997 ano
5.235
+2.024
63.04%
1 jan 1998 ano
7.626
+2.391
45.67%
1 jan 1999 ano
11.733
+4.107
53.85%
1 jan 2000 ano
17.427
+5.694
48.53%
1 jan 2001 ano
18.198
+0.771
4.42%
1 jan 2002 ano
13.656
-4.542
-24.96%
1 jan 2003 ano
14.284
+0.629
4.61%
1 jan 2004 ano
17.019
+2.735
19.15%
1 jan 2005 ano
27.648
+10.629
62.45%
1 jan 2006 ano
30.715
+3.067
11.09%
1 jan 2007 ano
43.166
+12.452
40.54%
1 jan 2008 ano
49.3
+6.134
14.21%
1 jan 2009 ano
17.013
-32.288
-65.49%
1 jan 2010 ano
34.325
+17.313
101.77%
1 jan 2011 ano
39.787
+5.461
15.91%
1 jan 2012 ano
26.142
-13.645
-34.3%
1 jan 2013 ano
35.457
+9.316
35.64%
1 jan 2014 ano
39.019
+3.562
10.04%
1 jan 2015 ano
30.981
-8.038
-20.6%
1 jan 2016 ano
28.878
-2.102
-6.79%

Classificação de países por estatísticas atuais por anos