29
/pt/
pt
AIzaSyAYiBZKx7MnpbEhh9jyipgxe19OcubqV5w
April 1, 2024
54374
Pacific island small states
PSS
false
2
1
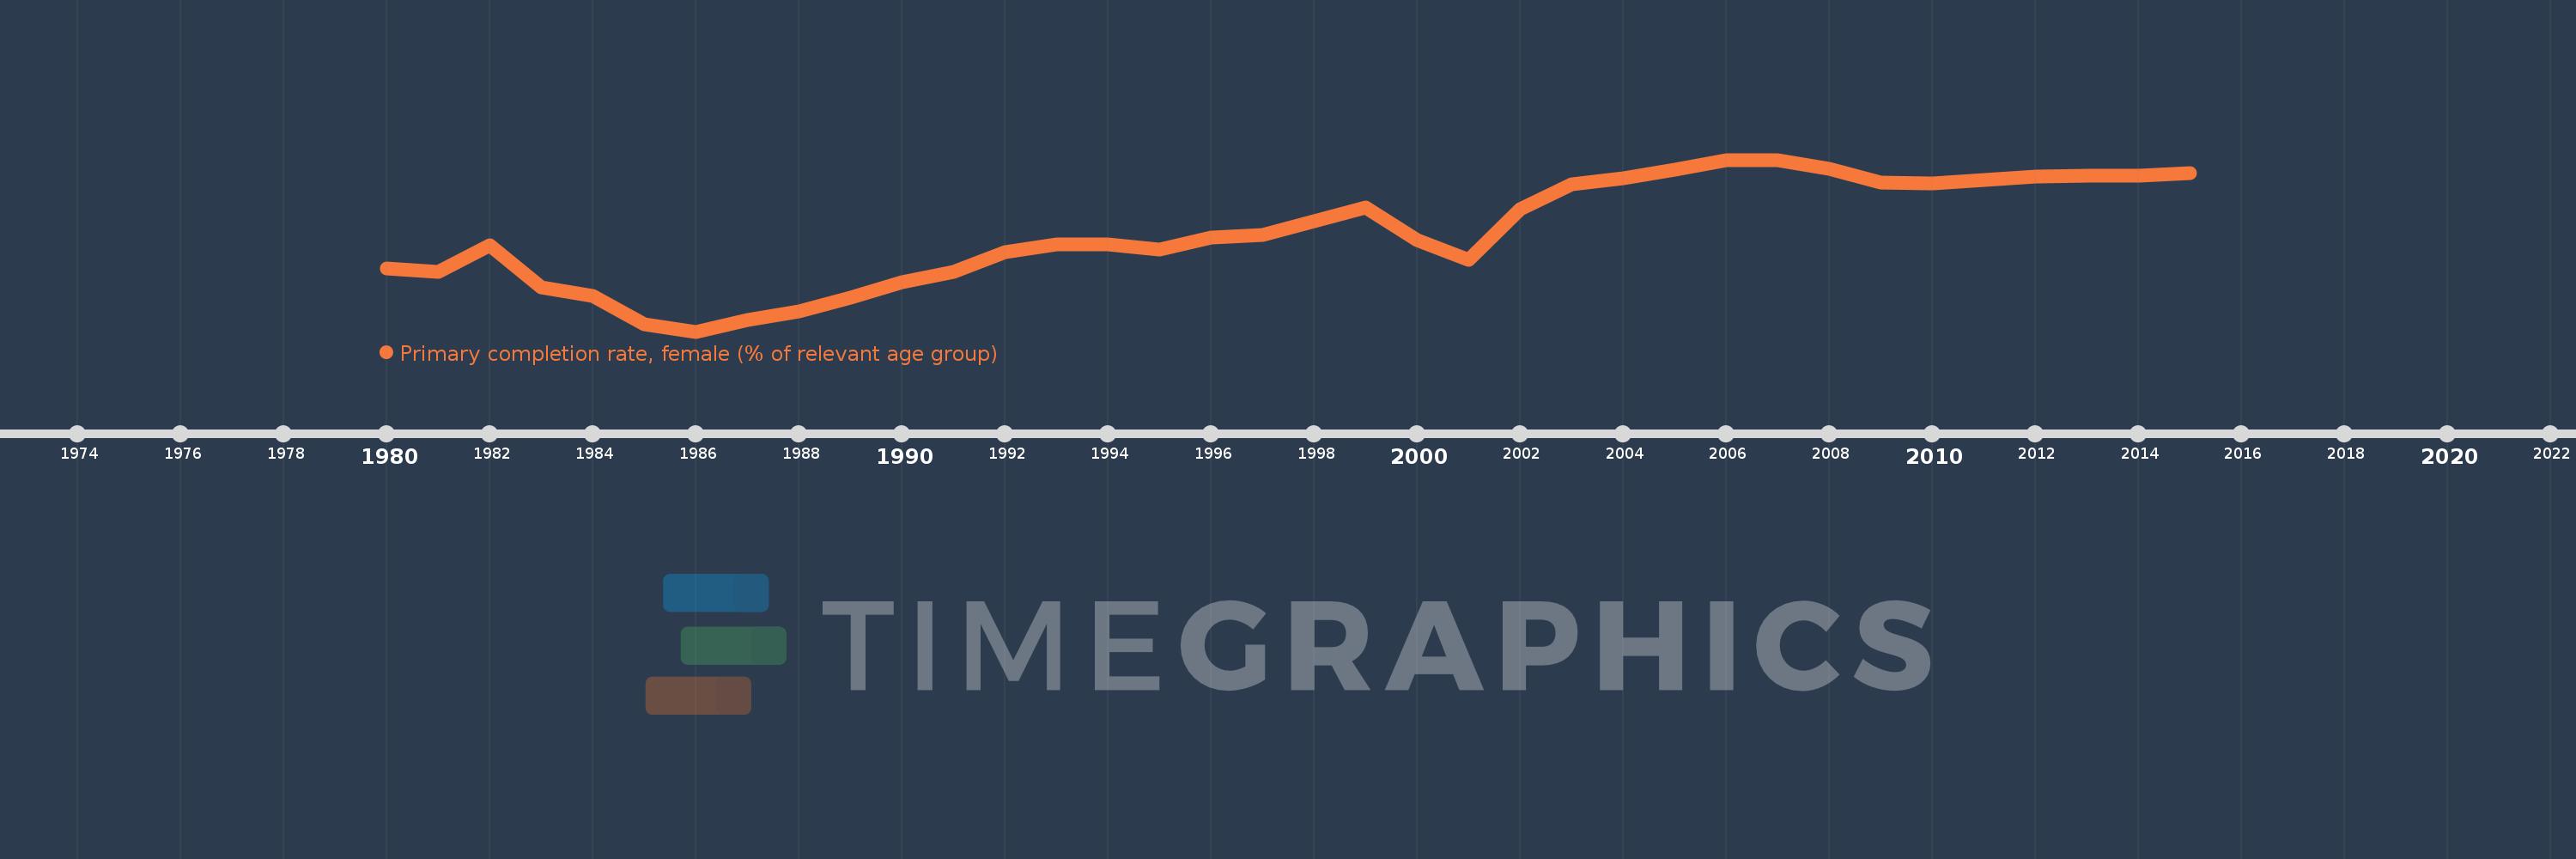
Primary completion rate, female (% of relevant age group)
2015,2014,2013,2012,2011,2010,2009,2008,2007,2006,2005,2004,2003,2002,2001,2000,1999,1998,1997,1996,1995,1994,1993,1992,1991,1990,1989,1988,1987,1986,1985,1984,1983,1982,1981,1980
Estas estatísticas em outros países:
AfghanistanAlbaniaAlgeriaAngolaAntigua and BarbudaArab WorldArgentinaArmeniaArubaAustriaAzerbaijanBahamas, TheBahrainBangladeshBarbadosBelarusBelgiumBelizeBeninBermudaBhutanBoliviaBosnia and HerzegovinaBotswanaBrunei DarussalamBulgariaBurkina FasoBurundiCabo VerdeCambodiaCameroonCanadaCaribbean small statesCentral African RepublicCentral Europe and the BalticsChadChileChinaColombiaComorosCongo, Dem. Rep.Congo, Rep.Costa RicaCote d'IvoireCroatiaCubaCyprusCzech RepublicDenmarkDjiboutiDominicaDominican RepublicEarly-demographic dividendEast Asia & PacificEast Asia & Pacific (excluding high income)East Asia & Pacific (IDA & IBRD countries)EcuadorEgypt, Arab Rep.El SalvadorEquatorial GuineaEritreaEstoniaEthiopiaEuro areaEurope & Central AsiaEurope & Central Asia (excluding high income)Europe & Central Asia (IDA & IBRD countries)European UnionFijiFinlandFragile and conflict affected situationsFranceGabonGambia, TheGeorgiaGermanyGhanaGreeceGrenadaGuatemalaGuineaGuinea-BissauGuyanaHaitiHeavily indebted poor countries (HIPC)High incomeHondurasHong Kong SAR, ChinaHungaryIBRD onlyIcelandIDA & IBRD totalIDA blendIDA onlyIDA totalIndiaIndonesiaIran, Islamic Rep.IraqIrelandIsraelItalyJamaicaJapanJordanKazakhstanKenyaKiribatiKorea, Dem. People’s Rep.Korea, Rep.KuwaitKyrgyz RepublicLao PDRLate-demographic dividendLatin America & Caribbean Latin America & Caribbean (excluding high income)Latin America & the Caribbean (IDA & IBRD countries)LatviaLeast developed countries: UN classificationLebanonLesothoLiberiaLibyaLiechtensteinLithuaniaLow & middle incomeLow incomeLower middle incomeLuxembourgMacao SAR, ChinaMacedonia, FYRMadagascarMalawiMaldivesMaliMaltaMarshall IslandsMauritaniaMauritiusMexicoMiddle East & North AfricaMiddle East & North Africa (excluding high income)Middle East & North Africa (IDA & IBRD countries)Middle incomeMoldovaMongoliaMontenegroMoroccoMozambiqueMyanmarNamibiaNauruNepalNetherlandsNew ZealandNicaraguaNigerNigeriaNorwayOECD membersOmanOther small statesPacific island small statesPakistanPalauPanamaPapua New GuineaParaguayPeruPhilippinesPolandPortugalPost-demographic dividendPre-demographic dividendQatarRomaniaRussian FederationRwandaSamoaSan MarinoSao Tome and PrincipeSaudi ArabiaSenegalSerbiaSeychellesSierra LeoneSlovak RepublicSloveniaSmall statesSolomon IslandsSouth AfricaSouth AsiaSouth Asia (IDA & IBRD)South SudanSpainSri LankaSt. Kitts and NevisSt. LuciaSt. Vincent and the GrenadinesSub-Saharan Africa Sub-Saharan Africa (excluding high income)Sub-Saharan Africa (IDA & IBRD countries)SudanSurinameSwazilandSwedenSwitzerlandSyrian Arab RepublicTajikistanTanzaniaThailandTimor-LesteTogoTongaTrinidad and TobagoTunisiaTurkeyTuvaluUgandaUkraineUnited Arab EmiratesUpper middle incomeUruguayUzbekistanVanuatuVenezuela, RBVietnamWest Bank and GazaWorldYemen, Rep.ZambiaZimbabwe Linha do tempo:
Nesta escala de tempo está apresentado um gráfico de 1980 ano até 2015 ano Pacific island small states. Dados de 1979 ano ausente. O número de observações reais por data: 36.
Fonte (nome):
Indicadores de desenvolvimento mundial
Fonte (organização):
United Nations Educational, Scientific, and Cultural Organization (UNESCO) Institute for Statistics.
Categorias:
Education, Gender
Foi atualizado:
23 abr 2017 ano
Indicadores de alterações dos valores ao longo dos anos
Mínimo:
83.66
1 jan 1986 ano
Máximo:
99.928
1 jan 2006 ano
Na data de observação
Valor
Mudança absoluta
A alteração em relação ao valor anterior
1 jan 1980 ano
89.62
+89.62
0.0%
1 jan 1981 ano
89.277
-0.343
-0.38%
1 jan 1982 ano
91.829
+2.553
2.86%
1 jan 1983 ano
87.868
-3.961
-4.31%
1 jan 1984 ano
87.068
-0.8
-0.91%
1 jan 1985 ano
84.368
-2.7
-3.1%
1 jan 1986 ano
83.66
-0.708
-0.84%
1 jan 1987 ano
84.772
+1.112
1.33%
1 jan 1988 ano
85.598
+0.825
0.97%
1 jan 1989 ano
86.848
+1.251
1.46%
1 jan 1990 ano
88.326
+1.478
1.7%
1 jan 1991 ano
89.323
+0.997
1.13%
1 jan 1992 ano
91.178
+1.855
2.08%
1 jan 1993 ano
91.938
+0.76
0.83%
1 jan 1994 ano
91.918
-0.02
-0.02%
1 jan 1995 ano
91.458
-0.46
-0.5%
1 jan 1996 ano
92.528
+1.07
1.17%
1 jan 1997 ano
92.829
+0.301
0.33%
1 jan 1998 ano
94.083
+1.254
1.35%
1 jan 1999 ano
95.415
+1.331
1.42%
1 jan 2000 ano
92.313
-3.102
-3.25%
1 jan 2001 ano
90.438
-1.875
-2.03%
1 jan 2002 ano
95.248
+4.811
5.32%
1 jan 2003 ano
97.59
+2.342
2.46%
1 jan 2004 ano
98.149
+0.559
0.57%
1 jan 2005 ano
98.986
+0.837
0.85%
1 jan 2006 ano
99.928
+0.941
0.95%
1 jan 2007 ano
99.904
-0.023
-0.02%
1 jan 2008 ano
99.07
-0.835
-0.84%
1 jan 2009 ano
97.766
-1.304
-1.32%
1 jan 2010 ano
97.656
-0.109
-0.11%
1 jan 2011 ano
97.976
+0.319
0.33%
1 jan 2012 ano
98.343
+0.368
0.38%
1 jan 2013 ano
98.402
+0.059
0.06%
1 jan 2014 ano
98.456
+0.054
0.05%
1 jan 2015 ano
98.646
+0.19
0.19%
Classificação de países por estatísticas atuais por anos


Comentários: