29
/pt/
pt
AIzaSyAYiBZKx7MnpbEhh9jyipgxe19OcubqV5w
April 1, 2024
36932
IBRD only
IBD
false
2
1
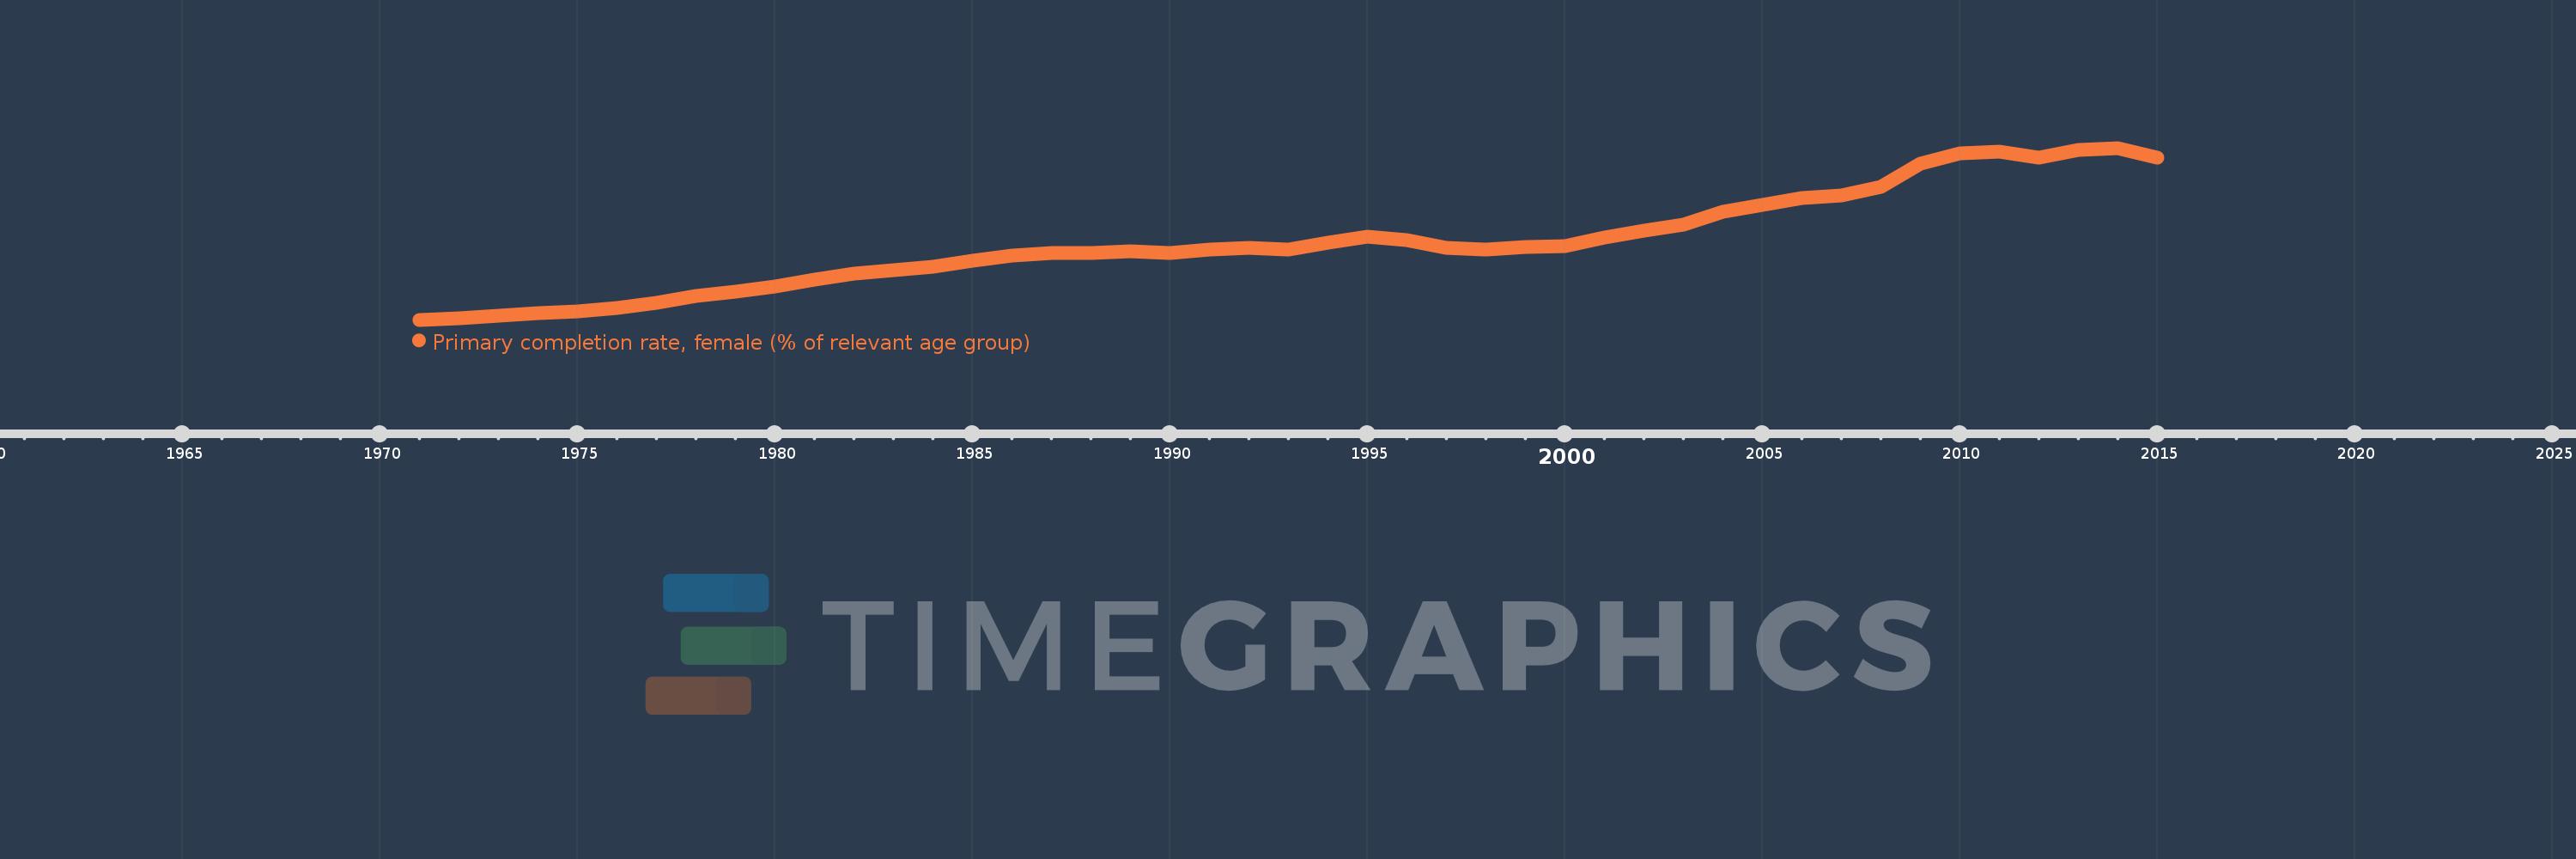
Primary completion rate, female (% of relevant age group)
2015,2014,2013,2012,2011,2010,2009,2008,2007,2006,2005,2004,2003,2002,2001,2000,1999,1998,1997,1996,1995,1994,1993,1992,1991,1990,1989,1988,1987,1986,1985,1984,1983,1982,1981,1980,1979,1978,1977,1976,1975,1974,1973,1972,1971
Estas estatísticas em outros países:
AfghanistanAlbaniaAlgeriaAngolaAntigua and BarbudaArab WorldArgentinaArmeniaArubaAustriaAzerbaijanBahamas, TheBahrainBangladeshBarbadosBelarusBelgiumBelizeBeninBermudaBhutanBoliviaBosnia and HerzegovinaBotswanaBrunei DarussalamBulgariaBurkina FasoBurundiCabo VerdeCambodiaCameroonCanadaCaribbean small statesCentral African RepublicCentral Europe and the BalticsChadChileChinaColombiaComorosCongo, Dem. Rep.Congo, Rep.Costa RicaCote d'IvoireCroatiaCubaCyprusCzech RepublicDenmarkDjiboutiDominicaDominican RepublicEarly-demographic dividendEast Asia & PacificEast Asia & Pacific (excluding high income)East Asia & Pacific (IDA & IBRD countries)EcuadorEgypt, Arab Rep.El SalvadorEquatorial GuineaEritreaEstoniaEthiopiaEuro areaEurope & Central AsiaEurope & Central Asia (excluding high income)Europe & Central Asia (IDA & IBRD countries)European UnionFijiFinlandFragile and conflict affected situationsFranceGabonGambia, TheGeorgiaGermanyGhanaGreeceGrenadaGuatemalaGuineaGuinea-BissauGuyanaHaitiHeavily indebted poor countries (HIPC)High incomeHondurasHong Kong SAR, ChinaHungaryIBRD onlyIcelandIDA & IBRD totalIDA blendIDA onlyIDA totalIndiaIndonesiaIran, Islamic Rep.IraqIrelandIsraelItalyJamaicaJapanJordanKazakhstanKenyaKiribatiKorea, Dem. People’s Rep.Korea, Rep.KuwaitKyrgyz RepublicLao PDRLate-demographic dividendLatin America & Caribbean Latin America & Caribbean (excluding high income)Latin America & the Caribbean (IDA & IBRD countries)LatviaLeast developed countries: UN classificationLebanonLesothoLiberiaLibyaLiechtensteinLithuaniaLow & middle incomeLow incomeLower middle incomeLuxembourgMacao SAR, ChinaMacedonia, FYRMadagascarMalawiMaldivesMaliMaltaMarshall IslandsMauritaniaMauritiusMexicoMiddle East & North AfricaMiddle East & North Africa (excluding high income)Middle East & North Africa (IDA & IBRD countries)Middle incomeMoldovaMongoliaMontenegroMoroccoMozambiqueMyanmarNamibiaNauruNepalNetherlandsNew ZealandNicaraguaNigerNigeriaNorwayOECD membersOmanOther small statesPacific island small statesPakistanPalauPanamaPapua New GuineaParaguayPeruPhilippinesPolandPortugalPost-demographic dividendPre-demographic dividendQatarRomaniaRussian FederationRwandaSamoaSan MarinoSao Tome and PrincipeSaudi ArabiaSenegalSerbiaSeychellesSierra LeoneSlovak RepublicSloveniaSmall statesSolomon IslandsSouth AfricaSouth AsiaSouth Asia (IDA & IBRD)South SudanSpainSri LankaSt. Kitts and NevisSt. LuciaSt. Vincent and the GrenadinesSub-Saharan Africa Sub-Saharan Africa (excluding high income)Sub-Saharan Africa (IDA & IBRD countries)SudanSurinameSwazilandSwedenSwitzerlandSyrian Arab RepublicTajikistanTanzaniaThailandTimor-LesteTogoTongaTrinidad and TobagoTunisiaTurkeyTuvaluUgandaUkraineUnited Arab EmiratesUpper middle incomeUruguayUzbekistanVanuatuVenezuela, RBVietnamWest Bank and GazaWorldYemen, Rep.ZambiaZimbabwe Linha do tempo:
Nesta escala de tempo está apresentado um gráfico de 1971 ano até 2015 ano IBRD only. Dados de 1970 ano ausente. O número de observações reais por data: 45.
Fonte (nome):
Indicadores de desenvolvimento mundial
Fonte (organização):
United Nations Educational, Scientific, and Cultural Organization (UNESCO) Institute for Statistics.
Categorias:
Education, Gender
Foi atualizado:
23 abr 2017 ano
Indicadores de alterações dos valores ao longo dos anos
Mínimo:
69.796
1 jan 1971 ano
Máximo:
99.404
1 jan 2014 ano
Na data de observação
Valor
Mudança absoluta
A alteração em relação ao valor anterior
1 jan 1971 ano
69.796
+69.796
0.0%
1 jan 1972 ano
70.085
+0.289
0.41%
1 jan 1973 ano
70.431
+0.346
0.49%
1 jan 1974 ano
70.967
+0.536
0.76%
1 jan 1975 ano
71.192
+0.225
0.32%
1 jan 1976 ano
71.802
+0.61
0.86%
1 jan 1977 ano
72.669
+0.867
1.21%
1 jan 1978 ano
73.91
+1.241
1.71%
1 jan 1979 ano
74.626
+0.716
0.97%
1 jan 1980 ano
75.486
+0.86
1.15%
1 jan 1981 ano
76.764
+1.278
1.69%
1 jan 1982 ano
77.683
+0.919
1.2%
1 jan 1983 ano
78.29
+0.607
0.78%
1 jan 1984 ano
78.96
+0.67
0.86%
1 jan 1985 ano
79.946
+0.986
1.25%
1 jan 1986 ano
80.926
+0.98
1.23%
1 jan 1987 ano
81.259
+0.333
0.41%
1 jan 1988 ano
81.281
+0.022
0.03%
1 jan 1989 ano
81.571
+0.29
0.36%
1 jan 1990 ano
81.357
-0.214
-0.26%
1 jan 1991 ano
81.891
+0.533
0.66%
1 jan 1992 ano
82.227
+0.337
0.41%
1 jan 1993 ano
81.882
-0.346
-0.42%
1 jan 1994 ano
83.004
+1.123
1.37%
1 jan 1995 ano
84.13
+1.126
1.36%
1 jan 1996 ano
83.518
-0.612
-0.73%
1 jan 1997 ano
82.198
-1.32
-1.58%
1 jan 1998 ano
81.84
-0.357
-0.43%
1 jan 1999 ano
82.27
+0.43
0.53%
1 jan 2000 ano
82.487
+0.216
0.26%
1 jan 2001 ano
83.904
+1.418
1.72%
1 jan 2002 ano
85.158
+1.253
1.49%
1 jan 2003 ano
86.176
+1.018
1.2%
1 jan 2004 ano
88.366
+2.191
2.54%
1 jan 2005 ano
89.638
+1.271
1.44%
1 jan 2006 ano
90.826
+1.189
1.33%
1 jan 2007 ano
91.199
+0.372
0.41%
1 jan 2008 ano
92.653
+1.454
1.59%
1 jan 2009 ano
96.743
+4.091
4.41%
1 jan 2010 ano
98.488
+1.744
1.8%
1 jan 2011 ano
98.814
+0.326
0.33%
1 jan 2012 ano
97.804
-1.01
-1.02%
1 jan 2013 ano
99.06
+1.257
1.28%
1 jan 2014 ano
99.404
+0.344
0.35%
1 jan 2015 ano
97.701
-1.703
-1.71%
Classificação de países por estatísticas atuais por anos


Comentários: