29
/pt/
pt
AIzaSyAYiBZKx7MnpbEhh9jyipgxe19OcubqV5w
April 1, 2024
153002
Hungary
HUN
true
2
1
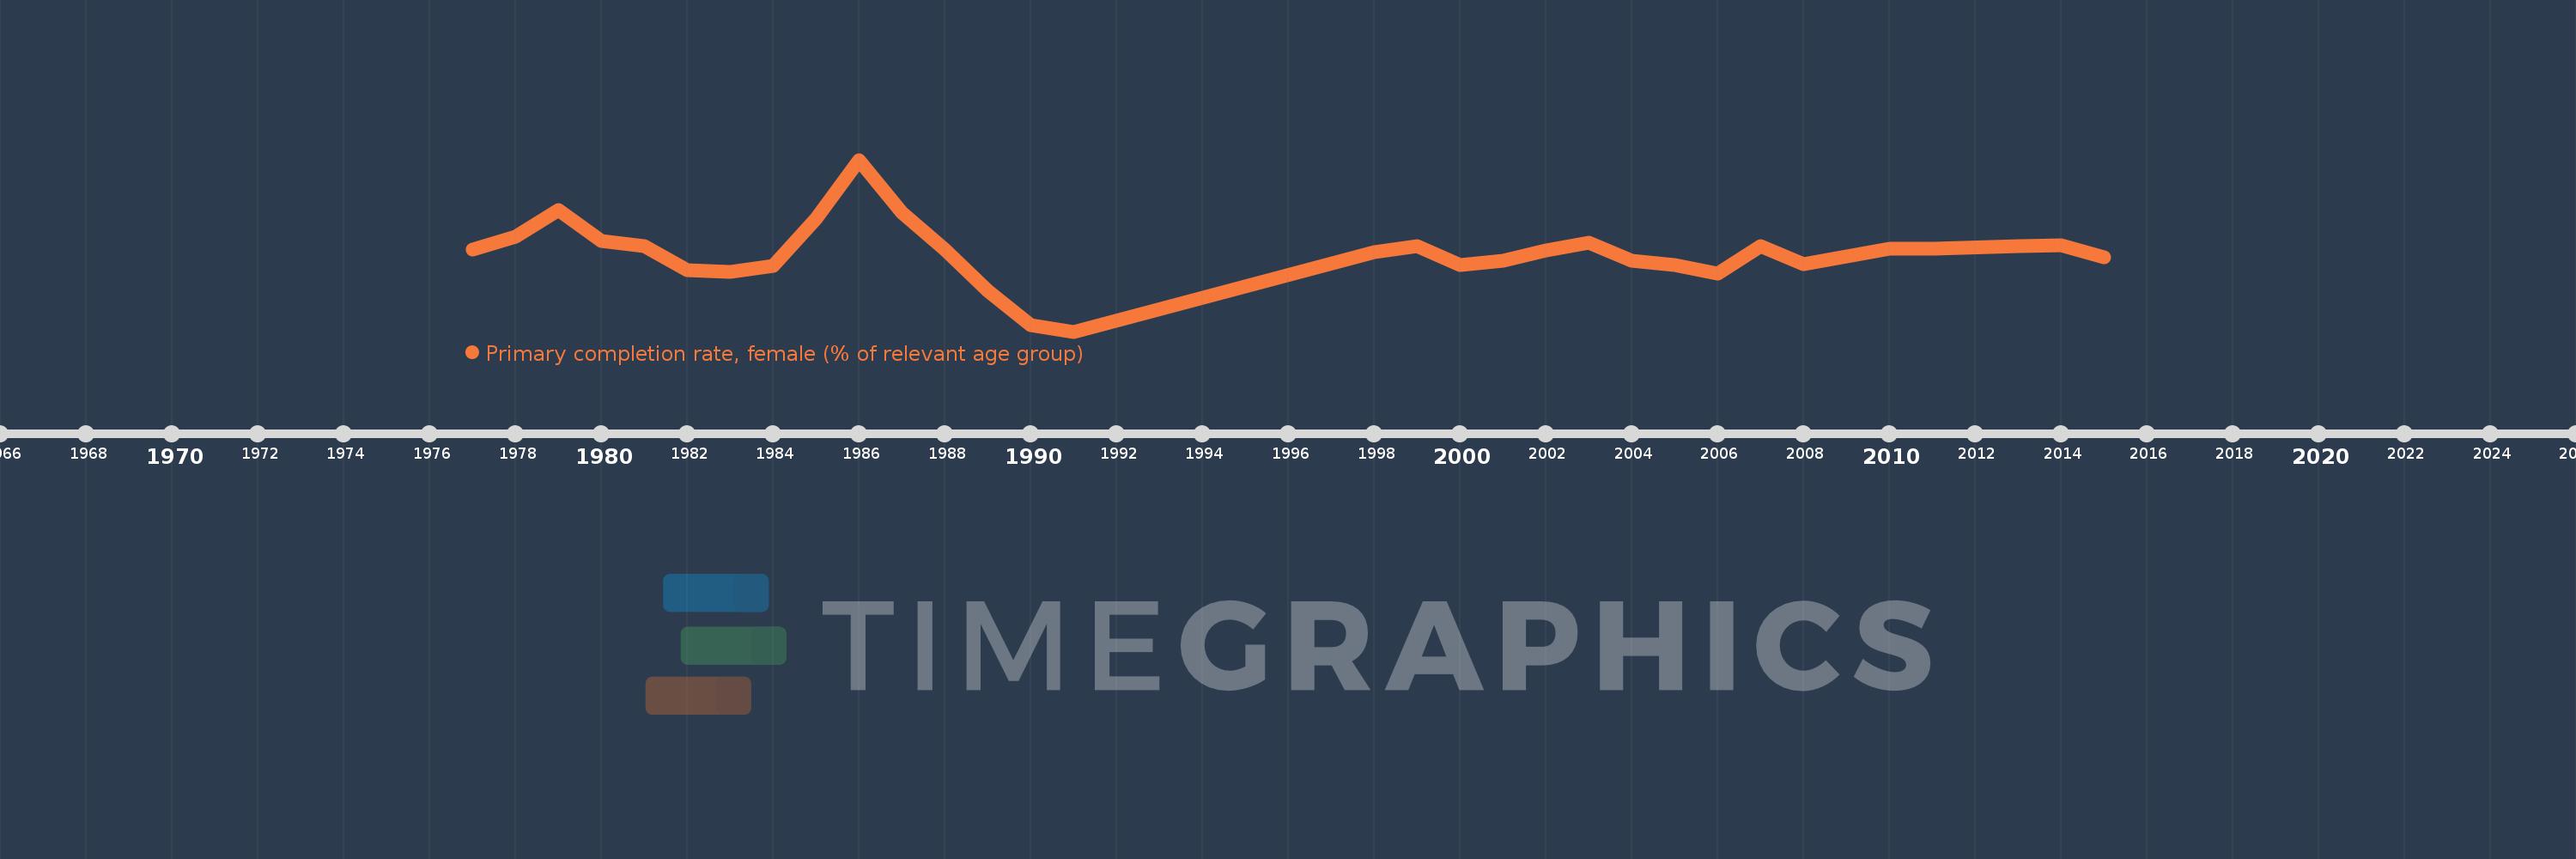
Primary completion rate, female (% of relevant age group)
2015,2014,2013,2011,2010,2009,2008,2007,2006,2005,2004,2003,2002,2001,2000,1999,1998,1991,1990,1989,1988,1987,1986,1985,1984,1983,1982,1981,1980,1979,1978,1977
Estas estatísticas em outros países:
AfghanistanAlbaniaAlgeriaAngolaAntigua and BarbudaArab WorldArgentinaArmeniaArubaAustriaAzerbaijanBahamas, TheBahrainBangladeshBarbadosBelarusBelgiumBelizeBeninBermudaBhutanBoliviaBosnia and HerzegovinaBotswanaBrunei DarussalamBulgariaBurkina FasoBurundiCabo VerdeCambodiaCameroonCanadaCaribbean small statesCentral African RepublicCentral Europe and the BalticsChadChileChinaColombiaComorosCongo, Dem. Rep.Congo, Rep.Costa RicaCote d'IvoireCroatiaCubaCyprusCzech RepublicDenmarkDjiboutiDominicaDominican RepublicEarly-demographic dividendEast Asia & PacificEast Asia & Pacific (excluding high income)East Asia & Pacific (IDA & IBRD countries)EcuadorEgypt, Arab Rep.El SalvadorEquatorial GuineaEritreaEstoniaEthiopiaEuro areaEurope & Central AsiaEurope & Central Asia (excluding high income)Europe & Central Asia (IDA & IBRD countries)European UnionFijiFinlandFragile and conflict affected situationsFranceGabonGambia, TheGeorgiaGermanyGhanaGreeceGrenadaGuatemalaGuineaGuinea-BissauGuyanaHaitiHeavily indebted poor countries (HIPC)High incomeHondurasHong Kong SAR, ChinaHungaryIBRD onlyIcelandIDA & IBRD totalIDA blendIDA onlyIDA totalIndiaIndonesiaIran, Islamic Rep.IraqIrelandIsraelItalyJamaicaJapanJordanKazakhstanKenyaKiribatiKorea, Dem. People’s Rep.Korea, Rep.KuwaitKyrgyz RepublicLao PDRLate-demographic dividendLatin America & Caribbean Latin America & Caribbean (excluding high income)Latin America & the Caribbean (IDA & IBRD countries)LatviaLeast developed countries: UN classificationLebanonLesothoLiberiaLibyaLiechtensteinLithuaniaLow & middle incomeLow incomeLower middle incomeLuxembourgMacao SAR, ChinaMacedonia, FYRMadagascarMalawiMaldivesMaliMaltaMarshall IslandsMauritaniaMauritiusMexicoMiddle East & North AfricaMiddle East & North Africa (excluding high income)Middle East & North Africa (IDA & IBRD countries)Middle incomeMoldovaMongoliaMontenegroMoroccoMozambiqueMyanmarNamibiaNauruNepalNetherlandsNew ZealandNicaraguaNigerNigeriaNorwayOECD membersOmanOther small statesPacific island small statesPakistanPalauPanamaPapua New GuineaParaguayPeruPhilippinesPolandPortugalPost-demographic dividendPre-demographic dividendQatarRomaniaRussian FederationRwandaSamoaSan MarinoSao Tome and PrincipeSaudi ArabiaSenegalSerbiaSeychellesSierra LeoneSlovak RepublicSloveniaSmall statesSolomon IslandsSouth AfricaSouth AsiaSouth Asia (IDA & IBRD)South SudanSpainSri LankaSt. Kitts and NevisSt. LuciaSt. Vincent and the GrenadinesSub-Saharan Africa Sub-Saharan Africa (excluding high income)Sub-Saharan Africa (IDA & IBRD countries)SudanSurinameSwazilandSwedenSwitzerlandSyrian Arab RepublicTajikistanTanzaniaThailandTimor-LesteTogoTongaTrinidad and TobagoTunisiaTurkeyTuvaluUgandaUkraineUnited Arab EmiratesUpper middle incomeUruguayUzbekistanVanuatuVenezuela, RBVietnamWest Bank and GazaWorldYemen, Rep.ZambiaZimbabwe Linha do tempo:
Nesta escala de tempo está apresentado um gráfico de 1977 ano até 2015 ano Hungary. Dados de 1976 ano ausente. O número de observações reais por data: 32.
Fonte (nome):
Indicadores de desenvolvimento mundial
Fonte (organização):
United Nations Educational, Scientific, and Cultural Organization (UNESCO) Institute for Statistics.
Categorias:
Education, Gender
Foi atualizado:
23 abr 2017 ano
Indicadores de alterações dos valores ao longo dos anos
Mínimo:
82.684
1 jan 1991 ano
Máximo:
114.308
1 jan 1986 ano
Na data de observação
Valor
Mudança absoluta
A alteração em relação ao valor anterior
1 jan 1977 ano
97.841
+97.841
0.0%
1 jan 1978 ano
100.136
+2.295
2.35%
1 jan 1979 ano
105.026
+4.89
4.88%
1 jan 1980 ano
99.366
-5.66
-5.39%
1 jan 1981 ano
98.365
-1.001
-1.01%
1 jan 1982 ano
93.971
-4.394
-4.47%
1 jan 1983 ano
93.634
-0.337
-0.36%
1 jan 1984 ano
94.722
+1.088
1.16%
1 jan 1985 ano
103.478
+8.756
9.24%
1 jan 1986 ano
114.308
+10.83
10.47%
1 jan 1987 ano
104.573
-9.735
-8.52%
1 jan 1988 ano
97.752
-6.821
-6.52%
1 jan 1989 ano
90.193
-7.559
-7.73%
1 jan 1990 ano
83.929
-6.264
-6.95%
1 jan 1991 ano
82.684
-1.245
-1.48%
1 jan 1998 ano
97.297
+14.613
17.67%
1 jan 1999 ano
98.473
+1.175
1.21%
1 jan 2000 ano
94.917
-3.556
-3.61%
1 jan 2001 ano
95.666
+0.749
0.79%
1 jan 2002 ano
97.67
+2.003
2.09%
1 jan 2003 ano
99.001
+1.332
1.36%
1 jan 2004 ano
95.712
-3.29
-3.32%
1 jan 2005 ano
94.892
-0.82
-0.86%
1 jan 2006 ano
93.3
-1.592
-1.68%
1 jan 2007 ano
98.35
+5.05
5.41%
1 jan 2008 ano
95.034
-3.316
-3.37%
1 jan 2009 ano
96.552
+1.518
1.6%
1 jan 2010 ano
97.915
+1.363
1.41%
1 jan 2011 ano
97.954
+0.04
0.04%
1 jan 2013 ano
98.48
+0.525
0.54%
1 jan 2014 ano
98.577
+0.097
0.1%
1 jan 2015 ano
96.409
-2.168
-2.2%
Classificação de países por estatísticas atuais por anos


Comentários: