29
/pt/
pt
AIzaSyAYiBZKx7MnpbEhh9jyipgxe19OcubqV5w
April 1, 2024
52632
OECD members
OED
false
2
1
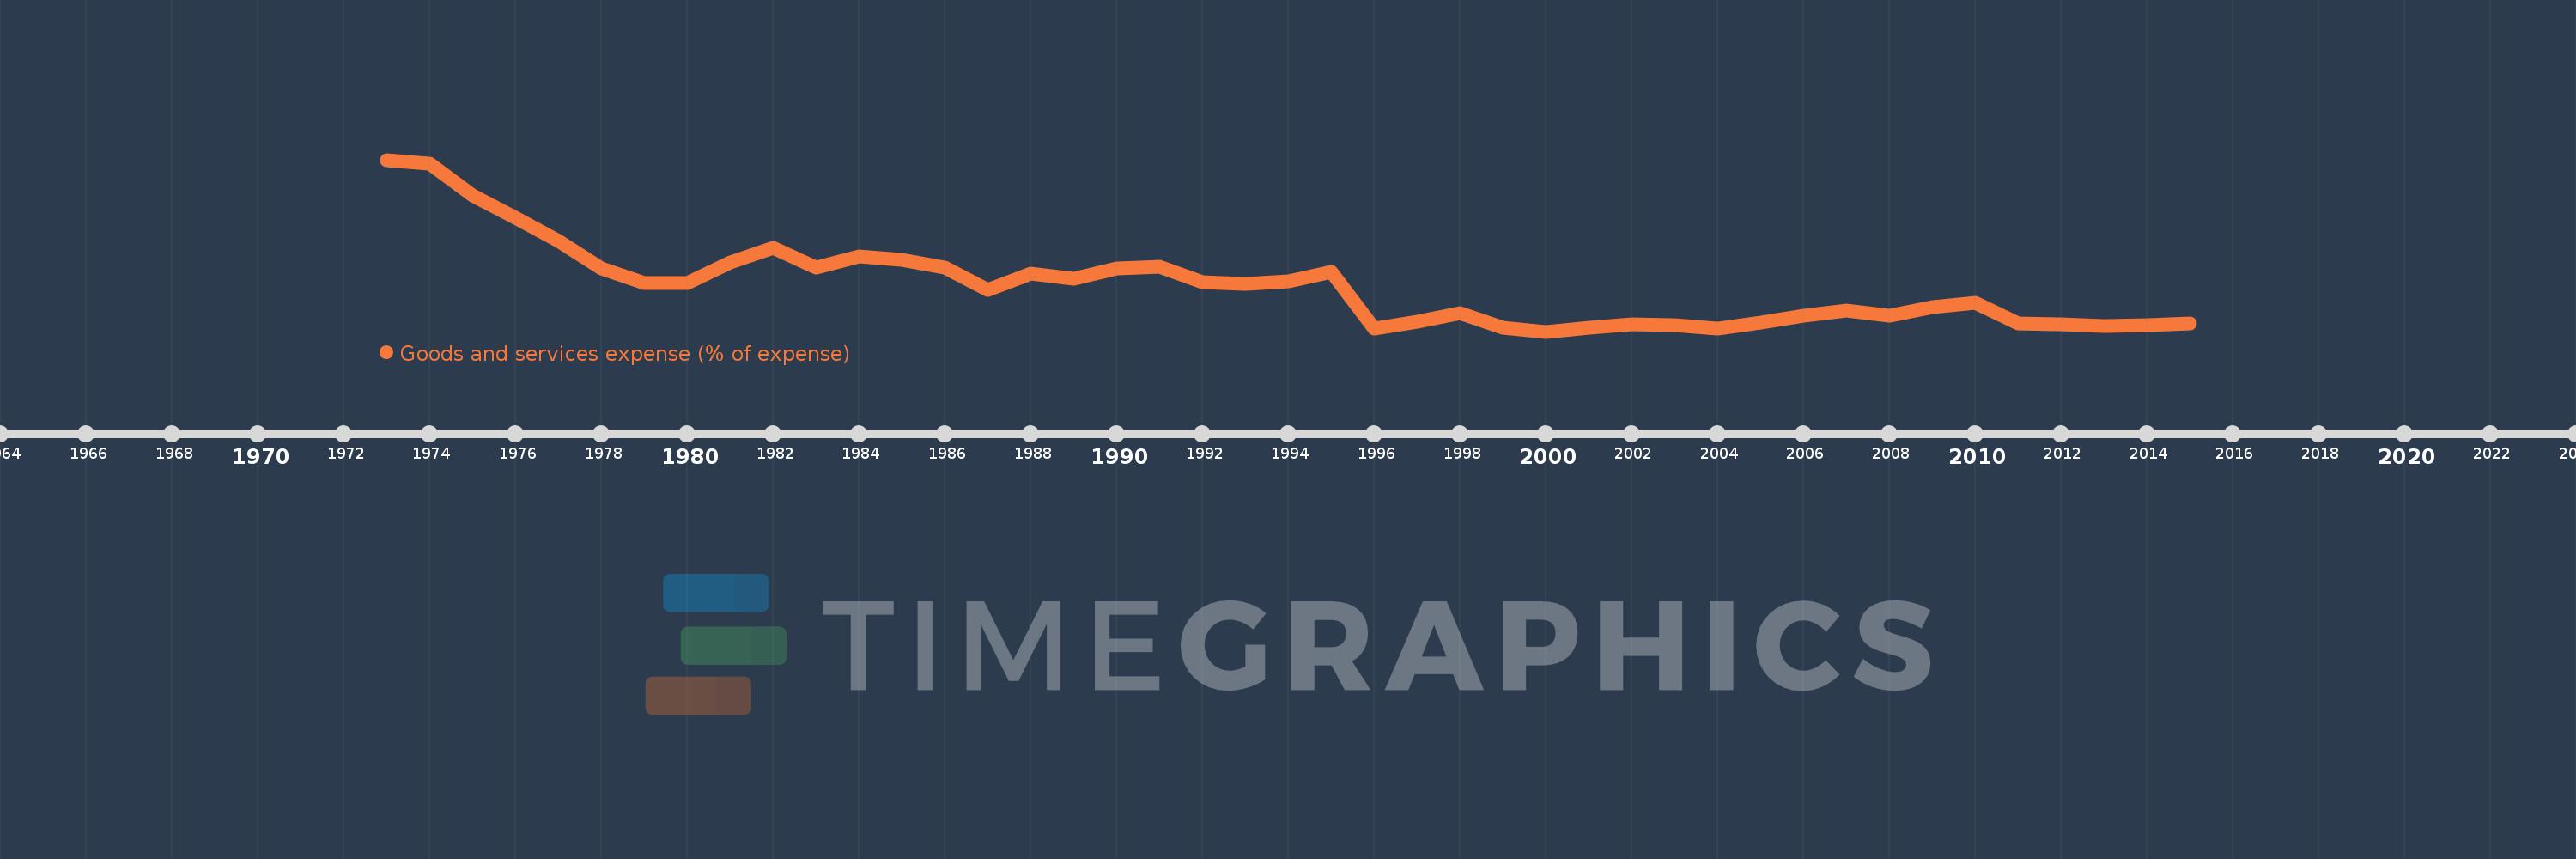
Goods and services expense (% of expense)
2015,2014,2013,2012,2011,2010,2009,2008,2007,2006,2005,2004,2003,2002,2001,2000,1999,1998,1997,1996,1995,1994,1993,1992,1991,1990,1989,1988,1987,1986,1985,1984,1983,1982,1981,1980,1979,1978,1977,1976,1975,1974,1973
Estas estatísticas em outros países:
AfghanistanAlbaniaAlgeriaAngolaAntigua and BarbudaArab WorldArmeniaAustraliaAustriaAzerbaijanBahamas, TheBahrainBangladeshBarbadosBelarusBelgiumBelizeBeninBhutanBoliviaBosnia and HerzegovinaBotswanaBrazilBulgariaBurkina FasoBurundiCabo VerdeCambodiaCanadaCaribbean small statesCentral African RepublicCentral Europe and the BalticsChileColombiaCongo, Dem. Rep.Congo, Rep.Costa RicaCote d'IvoireCroatiaCyprusCzech RepublicDenmarkDominicaDominican RepublicEarly-demographic dividendEast Asia & PacificEast Asia & Pacific (excluding high income)East Asia & Pacific (IDA & IBRD countries)Egypt, Arab Rep.El SalvadorEquatorial GuineaEstoniaEthiopiaEuro areaEurope & Central AsiaEurope & Central Asia (excluding high income)Europe & Central Asia (IDA & IBRD countries)European UnionFijiFinlandFranceGambia, TheGeorgiaGermanyGhanaGreeceGrenadaGuatemalaHeavily indebted poor countries (HIPC)High incomeHondurasHong Kong SAR, ChinaHungaryIBRD onlyIcelandIDA & IBRD totalIDA blendIDA onlyIDA totalIndiaIndonesiaIran, Islamic Rep.IraqIrelandIsraelItalyJamaicaJapanJordanKazakhstanKenyaKiribatiKorea, Rep.KuwaitKyrgyz RepublicLao PDRLate-demographic dividendLatin America & Caribbean Latin America & Caribbean (excluding high income)Latin America & the Caribbean (IDA & IBRD countries)LatviaLeast developed countries: UN classificationLebanonLesothoLiberiaLithuaniaLow & middle incomeLow incomeLower middle incomeLuxembourgMacao SAR, ChinaMacedonia, FYRMadagascarMalawiMalaysiaMaldivesMaliMaltaMauritiusMexicoMicronesia, Fed. Sts.Middle East & North AfricaMiddle East & North Africa (excluding high income)Middle East & North Africa (IDA & IBRD countries)Middle incomeMoldovaMongoliaMoroccoMozambiqueNamibiaNepalNetherlandsNew ZealandNicaraguaNigeriaNorth AmericaNorwayOECD membersOmanOther small statesPakistanPanamaPapua New GuineaParaguayPeruPhilippinesPolandPortugalPost-demographic dividendPre-demographic dividendQatarRomaniaRussian FederationRwandaSamoaSan MarinoSao Tome and PrincipeSenegalSerbiaSeychellesSierra LeoneSingaporeSlovak RepublicSloveniaSmall statesSolomon IslandsSouth AfricaSouth AsiaSouth Asia (IDA & IBRD)SpainSri LankaSt. Kitts and NevisSt. LuciaSub-Saharan Africa Sub-Saharan Africa (excluding high income)Sub-Saharan Africa (IDA & IBRD countries)SurinameSwazilandSwedenSwitzerlandSyrian Arab RepublicTajikistanTanzaniaThailandTimor-LesteTogoTrinidad and TobagoTunisiaTurkeyUgandaUkraineUnited Arab EmiratesUnited KingdomUnited StatesUpper middle incomeUruguayVanuatuVenezuela, RBWest Bank and GazaWorldYemen, Rep.ZambiaZimbabwe Linha do tempo:
Nesta escala de tempo está apresentado um gráfico de 1973 ano até 2015 ano OECD members. Dados de 1972 ano ausente. O número de observações reais por data: 43.
Fonte (nome):
Indicadores de desenvolvimento mundial
Fonte (organização):
International Monetary Fund, Government Finance Statistics Yearbook and data files.
Categorias:
Public Sector
Foi atualizado:
23 abr 2017 ano
Indicadores de alterações dos valores ao longo dos anos
Mínimo:
7.928
1 jan 2000 ano
Máximo:
16.495
1 jan 1973 ano
Na data de observação
Valor
Mudança absoluta
A alteração em relação ao valor anterior
1 jan 1973 ano
16.495
+16.495
0.0%
1 jan 1974 ano
16.288
-0.207
-1.26%
1 jan 1975 ano
14.696
-1.591
-9.77%
1 jan 1976 ano
13.609
-1.087
-7.39%
1 jan 1977 ano
12.451
-1.158
-8.51%
1 jan 1978 ano
11.093
-1.359
-10.91%
1 jan 1979 ano
10.351
-0.741
-6.68%
1 jan 1980 ano
10.351
-0.001
-0.01%
1 jan 1981 ano
11.377
+1.026
9.91%
1 jan 1982 ano
12.084
+0.707
6.21%
1 jan 1983 ano
11.137
-0.946
-7.83%
1 jan 1984 ano
11.672
+0.535
4.8%
1 jan 1985 ano
11.52
-0.152
-1.31%
1 jan 1986 ano
11.111
-0.408
-3.55%
1 jan 1987 ano
10.004
-1.108
-9.97%
1 jan 1988 ano
10.812
+0.809
8.08%
1 jan 1989 ano
10.548
-0.264
-2.44%
1 jan 1990 ano
11.094
+0.546
5.18%
1 jan 1991 ano
11.161
+0.067
0.6%
1 jan 1992 ano
10.406
-0.755
-6.76%
1 jan 1993 ano
10.326
-0.08
-0.77%
1 jan 1994 ano
10.433
+0.106
1.03%
1 jan 1995 ano
10.9
+0.467
4.48%
1 jan 1996 ano
8.081
-2.819
-25.87%
1 jan 1997 ano
8.432
+0.351
4.34%
1 jan 1998 ano
8.868
+0.436
5.17%
1 jan 1999 ano
8.118
-0.75
-8.45%
1 jan 2000 ano
7.928
-0.19
-2.34%
1 jan 2001 ano
8.108
+0.18
2.27%
1 jan 2002 ano
8.289
+0.181
2.24%
1 jan 2003 ano
8.231
-0.058
-0.7%
1 jan 2004 ano
8.086
-0.145
-1.76%
1 jan 2005 ano
8.367
+0.281
3.47%
1 jan 2006 ano
8.712
+0.345
4.13%
1 jan 2007 ano
8.965
+0.252
2.9%
1 jan 2008 ano
8.71
-0.255
-2.85%
1 jan 2009 ano
9.15
+0.44
5.05%
1 jan 2010 ano
9.343
+0.193
2.11%
1 jan 2011 ano
8.339
-1.004
-10.74%
1 jan 2012 ano
8.297
-0.042
-0.5%
1 jan 2013 ano
8.2
-0.097
-1.17%
1 jan 2014 ano
8.256
+0.056
0.68%
1 jan 2015 ano
8.334
+0.078
0.95%
Classificação de países por estatísticas atuais por anos


Comentários: