29
/pt/
pt
AIzaSyAYiBZKx7MnpbEhh9jyipgxe19OcubqV5w
April 1, 2024
207971
Netherlands
NLD
true
2
1
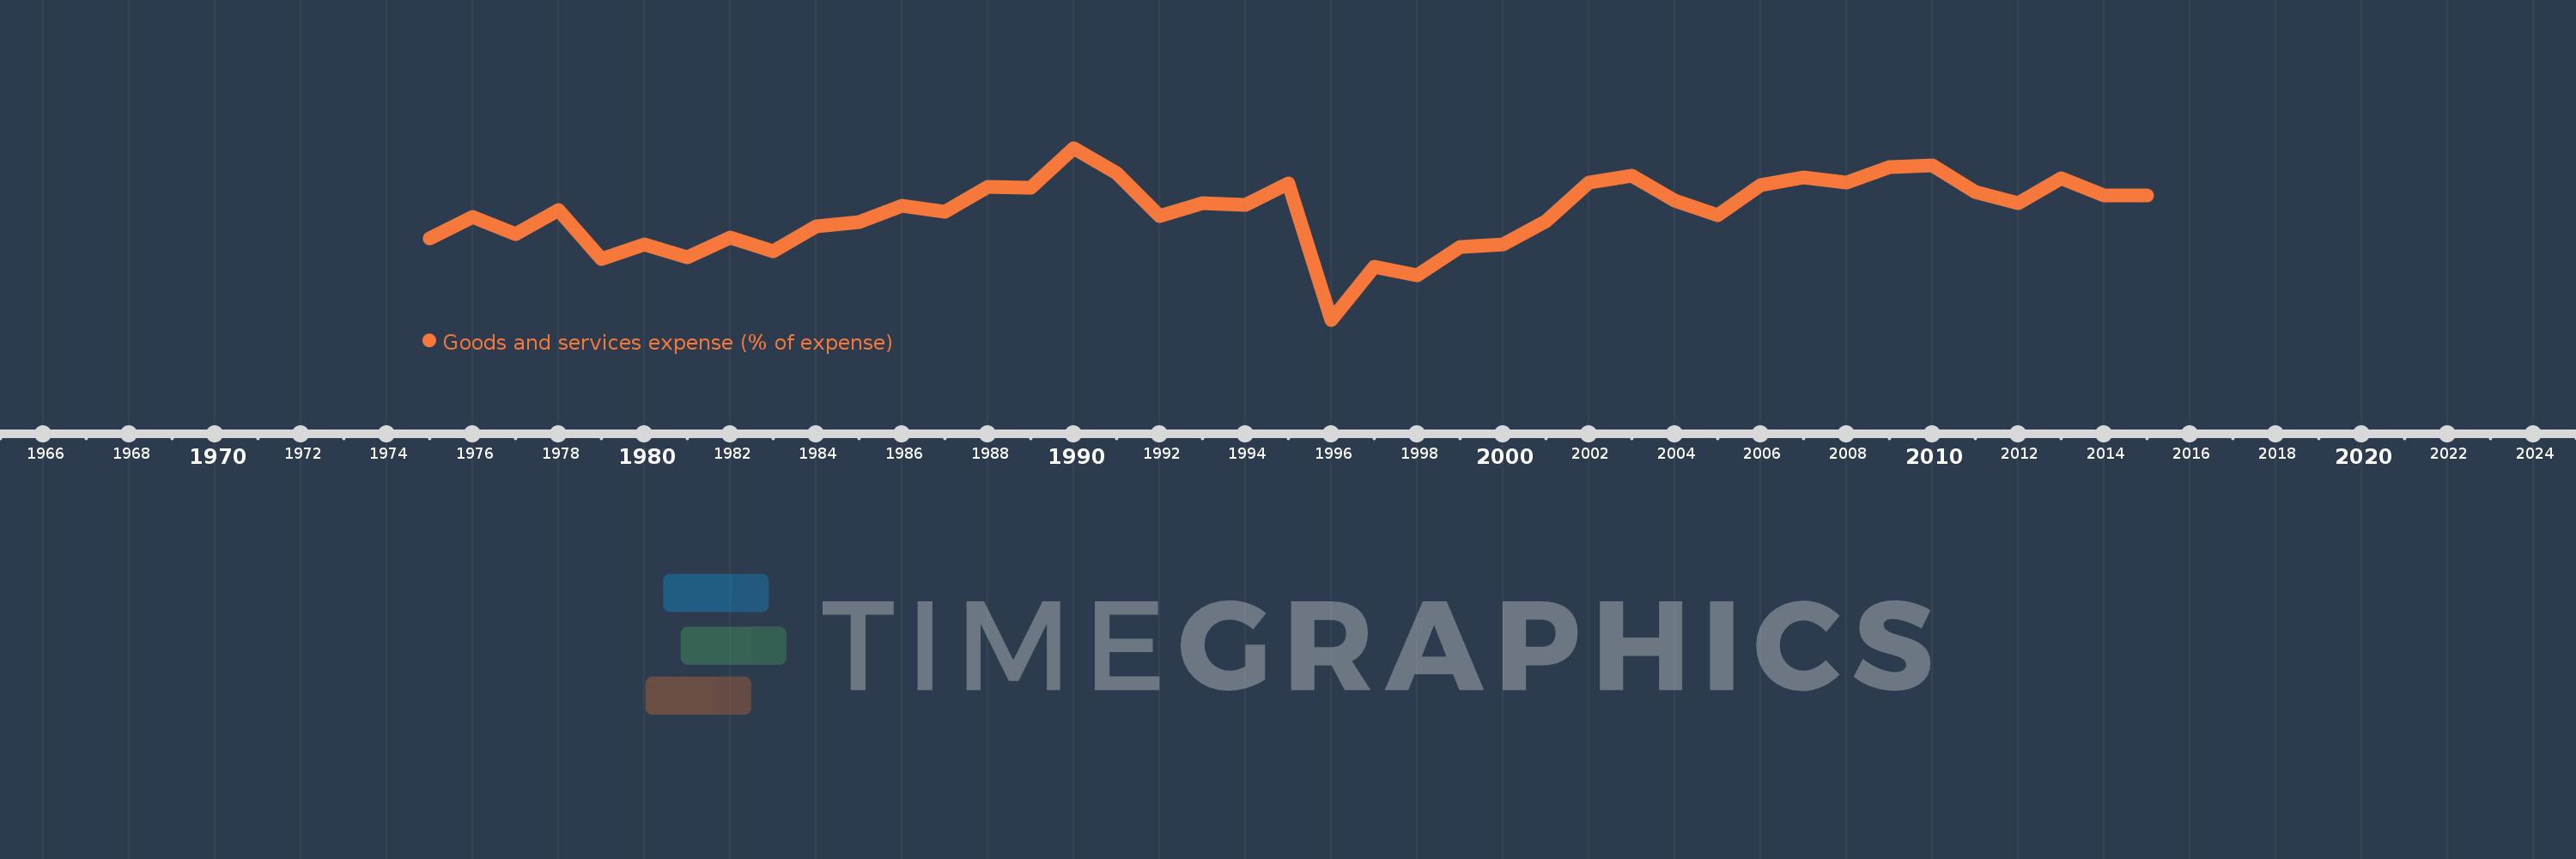
Goods and services expense (% of expense)
2015,2014,2013,2012,2011,2010,2009,2008,2007,2006,2005,2004,2003,2002,2001,2000,1999,1998,1997,1996,1995,1994,1993,1992,1991,1990,1989,1988,1987,1986,1985,1984,1983,1982,1981,1980,1979,1978,1977,1976,1975
Estas estatísticas em outros países:
AfghanistanAlbaniaAlgeriaAngolaAntigua and BarbudaArab WorldArmeniaAustraliaAustriaAzerbaijanBahamas, TheBahrainBangladeshBarbadosBelarusBelgiumBelizeBeninBhutanBoliviaBosnia and HerzegovinaBotswanaBrazilBulgariaBurkina FasoBurundiCabo VerdeCambodiaCanadaCaribbean small statesCentral African RepublicCentral Europe and the BalticsChileColombiaCongo, Dem. Rep.Congo, Rep.Costa RicaCote d'IvoireCroatiaCyprusCzech RepublicDenmarkDominicaDominican RepublicEarly-demographic dividendEast Asia & PacificEast Asia & Pacific (excluding high income)East Asia & Pacific (IDA & IBRD countries)Egypt, Arab Rep.El SalvadorEquatorial GuineaEstoniaEthiopiaEuro areaEurope & Central AsiaEurope & Central Asia (excluding high income)Europe & Central Asia (IDA & IBRD countries)European UnionFijiFinlandFranceGambia, TheGeorgiaGermanyGhanaGreeceGrenadaGuatemalaHeavily indebted poor countries (HIPC)High incomeHondurasHong Kong SAR, ChinaHungaryIBRD onlyIcelandIDA & IBRD totalIDA blendIDA onlyIDA totalIndiaIndonesiaIran, Islamic Rep.IraqIrelandIsraelItalyJamaicaJapanJordanKazakhstanKenyaKiribatiKorea, Rep.KuwaitKyrgyz RepublicLao PDRLate-demographic dividendLatin America & Caribbean Latin America & Caribbean (excluding high income)Latin America & the Caribbean (IDA & IBRD countries)LatviaLeast developed countries: UN classificationLebanonLesothoLiberiaLithuaniaLow & middle incomeLow incomeLower middle incomeLuxembourgMacao SAR, ChinaMacedonia, FYRMadagascarMalawiMalaysiaMaldivesMaliMaltaMauritiusMexicoMicronesia, Fed. Sts.Middle East & North AfricaMiddle East & North Africa (excluding high income)Middle East & North Africa (IDA & IBRD countries)Middle incomeMoldovaMongoliaMoroccoMozambiqueNamibiaNepalNetherlandsNew ZealandNicaraguaNigeriaNorth AmericaNorwayOECD membersOmanOther small statesPakistanPanamaPapua New GuineaParaguayPeruPhilippinesPolandPortugalPost-demographic dividendPre-demographic dividendQatarRomaniaRussian FederationRwandaSamoaSan MarinoSao Tome and PrincipeSenegalSerbiaSeychellesSierra LeoneSingaporeSlovak RepublicSloveniaSmall statesSolomon IslandsSouth AfricaSouth AsiaSouth Asia (IDA & IBRD)SpainSri LankaSt. Kitts and NevisSt. LuciaSub-Saharan Africa Sub-Saharan Africa (excluding high income)Sub-Saharan Africa (IDA & IBRD countries)SurinameSwazilandSwedenSwitzerlandSyrian Arab RepublicTajikistanTanzaniaThailandTimor-LesteTogoTrinidad and TobagoTunisiaTurkeyUgandaUkraineUnited Arab EmiratesUnited KingdomUnited StatesUpper middle incomeUruguayVanuatuVenezuela, RBWest Bank and GazaWorldYemen, Rep.ZambiaZimbabwe Linha do tempo:
Nesta escala de tempo está apresentado um gráfico de 1975 ano até 2015 ano Netherlands. Dados de 1974 ano ausente. O número de observações reais por data: 41.
Fonte (nome):
Indicadores de desenvolvimento mundial
Fonte (organização):
International Monetary Fund, Government Finance Statistics Yearbook and data files.
Categorias:
Public Sector
Foi atualizado:
23 abr 2017 ano
Indicadores de alterações dos valores ao longo dos anos
Mínimo:
4.443
1 jan 1996 ano
Máximo:
6.543
1 jan 1990 ano
Na data de observação
Valor
Mudança absoluta
A alteração em relação ao valor anterior
1 jan 1975 ano
5.435
+5.435
0.0%
1 jan 1976 ano
5.701
+0.265
4.88%
1 jan 1977 ano
5.486
-0.215
-3.77%
1 jan 1978 ano
5.779
+0.294
5.36%
1 jan 1979 ano
5.182
-0.597
-10.33%
1 jan 1980 ano
5.361
+0.179
3.45%
1 jan 1981 ano
5.211
-0.149
-2.79%
1 jan 1982 ano
5.453
+0.242
4.64%
1 jan 1983 ano
5.284
-0.169
-3.1%
1 jan 1984 ano
5.587
+0.303
5.73%
1 jan 1985 ano
5.639
+0.052
0.94%
1 jan 1986 ano
5.839
+0.2
3.55%
1 jan 1987 ano
5.759
-0.08
-1.37%
1 jan 1988 ano
6.063
+0.304
5.28%
1 jan 1989 ano
6.058
-0.005
-0.09%
1 jan 1990 ano
6.543
+0.485
8.01%
1 jan 1991 ano
6.24
-0.303
-4.63%
1 jan 1992 ano
5.714
-0.526
-8.44%
1 jan 1993 ano
5.869
+0.155
2.71%
1 jan 1994 ano
5.848
-0.021
-0.36%
1 jan 1995 ano
6.109
+0.261
4.47%
1 jan 1996 ano
4.443
-1.667
-27.28%
1 jan 1997 ano
5.093
+0.65
14.64%
1 jan 1998 ano
4.985
-0.108
-2.12%
1 jan 1999 ano
5.336
+0.351
7.03%
1 jan 2000 ano
5.364
+0.028
0.53%
1 jan 2001 ano
5.65
+0.286
5.33%
1 jan 2002 ano
6.116
+0.465
8.24%
1 jan 2003 ano
6.207
+0.091
1.49%
1 jan 2004 ano
5.899
-0.308
-4.96%
1 jan 2005 ano
5.721
-0.178
-3.02%
1 jan 2006 ano
6.092
+0.371
6.49%
1 jan 2007 ano
6.179
+0.087
1.43%
1 jan 2008 ano
6.118
-0.061
-0.99%
1 jan 2009 ano
6.312
+0.194
3.17%
1 jan 2010 ano
6.334
+0.022
0.35%
1 jan 2011 ano
6.004
-0.33
-5.22%
1 jan 2012 ano
5.863
-0.14
-2.34%
1 jan 2013 ano
6.168
+0.305
5.21%
1 jan 2014 ano
5.958
-0.21
-3.41%
1 jan 2015 ano
5.967
+0.009
0.15%
Classificação de países por estatísticas atuais por anos


Comentários: