29
/pt/
pt
AIzaSyAYiBZKx7MnpbEhh9jyipgxe19OcubqV5w
April 1, 2024
157316
Iran, Islamic Rep.
IRN
true
2
1
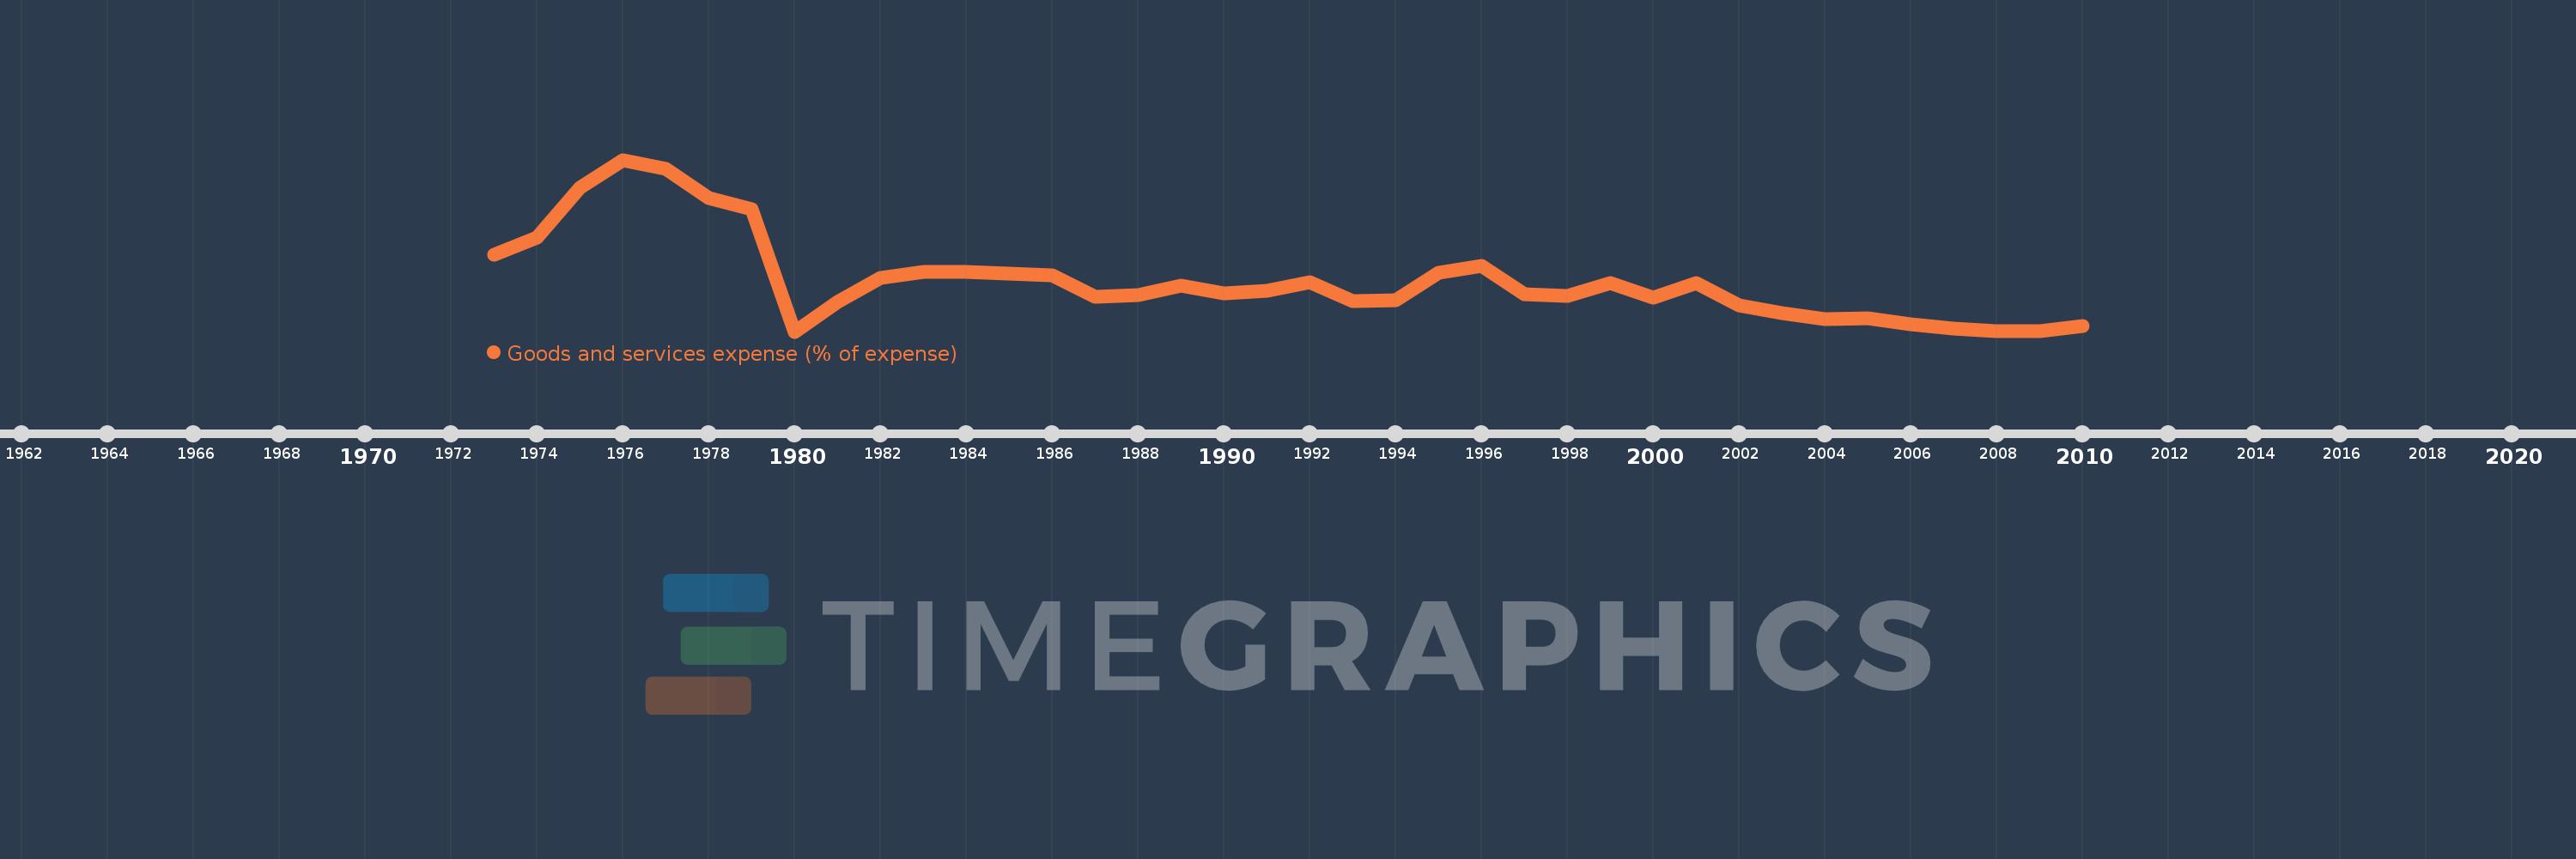
Goods and services expense (% of expense)
2010,2009,2008,2007,2006,2005,2004,2003,2002,2001,2000,1999,1998,1997,1996,1995,1994,1993,1992,1991,1990,1989,1988,1987,1986,1985,1984,1983,1982,1981,1980,1979,1978,1977,1976,1975,1974,1973
Estas estatísticas em outros países:
AfghanistanAlbaniaAlgeriaAngolaAntigua and BarbudaArab WorldArmeniaAustraliaAustriaAzerbaijanBahamas, TheBahrainBangladeshBarbadosBelarusBelgiumBelizeBeninBhutanBoliviaBosnia and HerzegovinaBotswanaBrazilBulgariaBurkina FasoBurundiCabo VerdeCambodiaCanadaCaribbean small statesCentral African RepublicCentral Europe and the BalticsChileColombiaCongo, Dem. Rep.Congo, Rep.Costa RicaCote d'IvoireCroatiaCyprusCzech RepublicDenmarkDominicaDominican RepublicEarly-demographic dividendEast Asia & PacificEast Asia & Pacific (excluding high income)East Asia & Pacific (IDA & IBRD countries)Egypt, Arab Rep.El SalvadorEquatorial GuineaEstoniaEthiopiaEuro areaEurope & Central AsiaEurope & Central Asia (excluding high income)Europe & Central Asia (IDA & IBRD countries)European UnionFijiFinlandFranceGambia, TheGeorgiaGermanyGhanaGreeceGrenadaGuatemalaHeavily indebted poor countries (HIPC)High incomeHondurasHong Kong SAR, ChinaHungaryIBRD onlyIcelandIDA & IBRD totalIDA blendIDA onlyIDA totalIndiaIndonesiaIran, Islamic Rep.IraqIrelandIsraelItalyJamaicaJapanJordanKazakhstanKenyaKiribatiKorea, Rep.KuwaitKyrgyz RepublicLao PDRLate-demographic dividendLatin America & Caribbean Latin America & Caribbean (excluding high income)Latin America & the Caribbean (IDA & IBRD countries)LatviaLeast developed countries: UN classificationLebanonLesothoLiberiaLithuaniaLow & middle incomeLow incomeLower middle incomeLuxembourgMacao SAR, ChinaMacedonia, FYRMadagascarMalawiMalaysiaMaldivesMaliMaltaMauritiusMexicoMicronesia, Fed. Sts.Middle East & North AfricaMiddle East & North Africa (excluding high income)Middle East & North Africa (IDA & IBRD countries)Middle incomeMoldovaMongoliaMoroccoMozambiqueNamibiaNepalNetherlandsNew ZealandNicaraguaNigeriaNorth AmericaNorwayOECD membersOmanOther small statesPakistanPanamaPapua New GuineaParaguayPeruPhilippinesPolandPortugalPost-demographic dividendPre-demographic dividendQatarRomaniaRussian FederationRwandaSamoaSan MarinoSao Tome and PrincipeSenegalSerbiaSeychellesSierra LeoneSingaporeSlovak RepublicSloveniaSmall statesSolomon IslandsSouth AfricaSouth AsiaSouth Asia (IDA & IBRD)SpainSri LankaSt. Kitts and NevisSt. LuciaSub-Saharan Africa Sub-Saharan Africa (excluding high income)Sub-Saharan Africa (IDA & IBRD countries)SurinameSwazilandSwedenSwitzerlandSyrian Arab RepublicTajikistanTanzaniaThailandTimor-LesteTogoTrinidad and TobagoTunisiaTurkeyUgandaUkraineUnited Arab EmiratesUnited KingdomUnited StatesUpper middle incomeUruguayVanuatuVenezuela, RBWest Bank and GazaWorldYemen, Rep.ZambiaZimbabwe Linha do tempo:
Nesta escala de tempo está apresentado um gráfico de 1973 ano até 2010 ano Iran, Islamic Rep.. Dados de 1972 ano ausente. O número de observações reais por data: 38.
Fonte (nome):
Indicadores de desenvolvimento mundial
Fonte (organização):
International Monetary Fund, Government Finance Statistics Yearbook and data files.
Categorias:
Public Sector
Foi atualizado:
23 abr 2017 ano
Indicadores de alterações dos valores ao longo dos anos
Mínimo:
9.832
1 jan 1980 ano
Máximo:
38.32
1 jan 1976 ano
Na data de observação
Valor
Mudança absoluta
A alteração em relação ao valor anterior
1 jan 1973 ano
22.609
+22.609
0.0%
1 jan 1974 ano
25.392
+2.782
12.31%
1 jan 1975 ano
33.653
+8.261
32.53%
1 jan 1976 ano
38.32
+4.668
13.87%
1 jan 1977 ano
36.826
-1.494
-3.9%
1 jan 1978 ano
31.942
-4.885
-13.26%
1 jan 1979 ano
30.088
-1.854
-5.81%
1 jan 1980 ano
9.832
-20.256
-67.32%
1 jan 1981 ano
14.808
+4.976
50.61%
1 jan 1982 ano
18.738
+3.93
26.54%
1 jan 1983 ano
19.772
+1.034
5.52%
1 jan 1984 ano
19.745
-0.027
-0.14%
1 jan 1985 ano
19.502
-0.243
-1.23%
1 jan 1986 ano
19.093
-0.409
-2.1%
1 jan 1987 ano
15.635
-3.458
-18.11%
1 jan 1988 ano
15.823
+0.188
1.2%
1 jan 1989 ano
17.387
+1.564
9.89%
1 jan 1990 ano
16.189
-1.198
-6.89%
1 jan 1991 ano
16.572
+0.383
2.36%
1 jan 1992 ano
18.065
+1.494
9.01%
1 jan 1993 ano
14.935
-3.13
-17.33%
1 jan 1994 ano
15.05
+0.114
0.77%
1 jan 1995 ano
19.561
+4.511
29.97%
1 jan 1996 ano
20.706
+1.146
5.86%
1 jan 1997 ano
15.985
-4.721
-22.8%
1 jan 1998 ano
15.803
-0.181
-1.13%
1 jan 1999 ano
17.935
+2.132
13.49%
1 jan 2000 ano
15.388
-2.547
-14.2%
1 jan 2001 ano
17.933
+2.545
16.54%
1 jan 2002 ano
14.199
-3.734
-20.82%
1 jan 2003 ano
12.892
-1.307
-9.2%
1 jan 2004 ano
11.939
-0.953
-7.39%
1 jan 2005 ano
12.063
+0.123
1.03%
1 jan 2006 ano
10.974
-1.089
-9.03%
1 jan 2007 ano
10.316
-0.657
-5.99%
1 jan 2008 ano
9.833
-0.483
-4.68%
1 jan 2009 ano
9.91
+0.076
0.78%
1 jan 2010 ano
10.725
+0.816
8.23%
Classificação de países por estatísticas atuais por anos


Comentários: