29
/pt/
pt
AIzaSyAYiBZKx7MnpbEhh9jyipgxe19OcubqV5w
April 1, 2024
52562
OECD members
OED
false
2
1
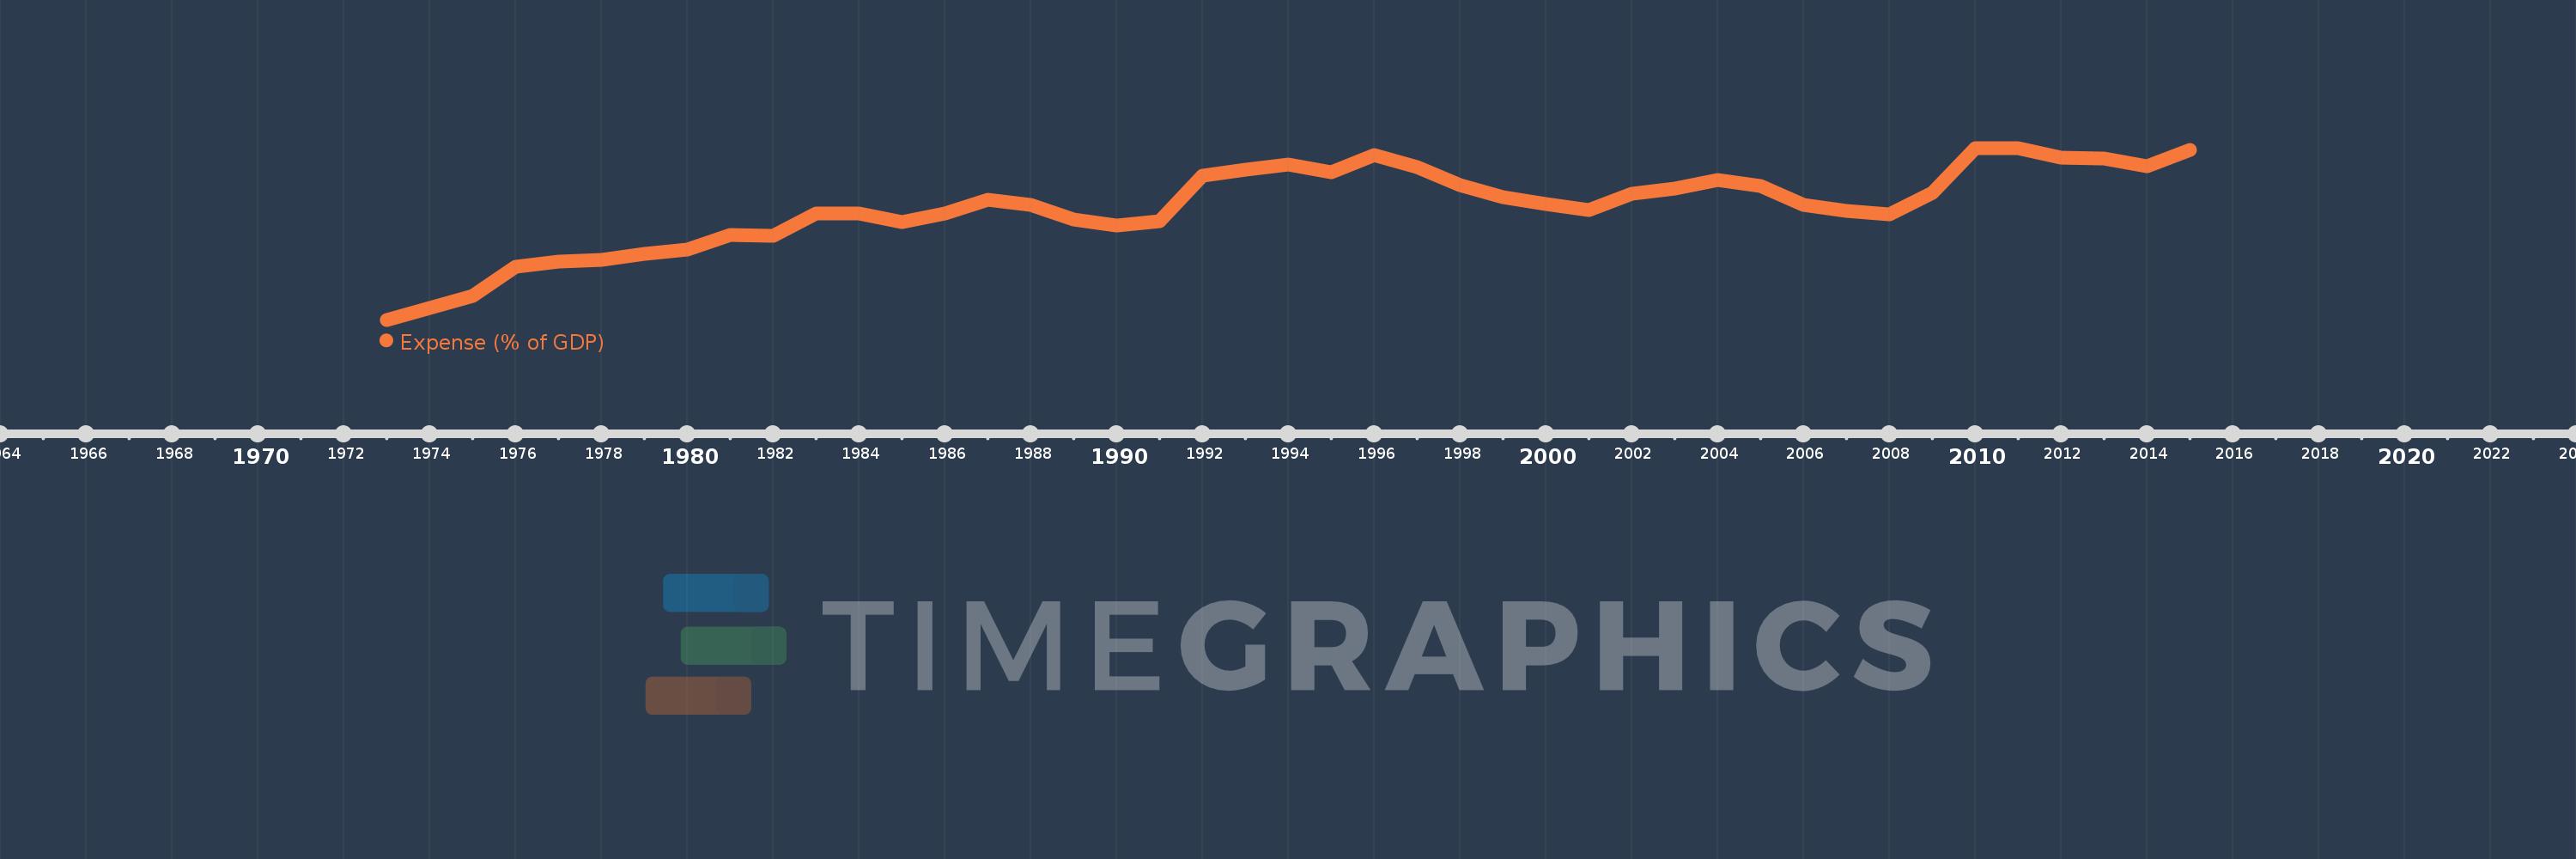
Expense (% of GDP)
2015,2014,2013,2012,2011,2010,2009,2008,2007,2006,2005,2004,2003,2002,2001,2000,1999,1998,1997,1996,1995,1994,1993,1992,1991,1990,1989,1988,1987,1986,1985,1984,1983,1982,1981,1980,1979,1978,1977,1976,1975,1974,1973
Estas estatísticas em outros países:
AfghanistanAlbaniaAlgeriaAngolaAntigua and BarbudaArmeniaAustraliaAustriaAzerbaijanBahamas, TheBahrainBangladeshBarbadosBelarusBelgiumBelizeBeninBhutanBoliviaBosnia and HerzegovinaBotswanaBrazilBulgariaBurkina FasoBurundiCabo VerdeCambodiaCanadaCaribbean small statesCentral African RepublicCentral Europe and the BalticsChileColombiaCongo, Dem. Rep.Congo, Rep.Costa RicaCote d'IvoireCroatiaCyprusCzech RepublicDenmarkDominicaDominican RepublicEarly-demographic dividendEgypt, Arab Rep.El SalvadorEquatorial GuineaEstoniaEthiopiaEuro areaEurope & Central AsiaEurope & Central Asia (excluding high income)Europe & Central Asia (IDA & IBRD countries)European UnionFijiFinlandFranceGambia, TheGeorgiaGermanyGhanaGreeceGrenadaGuatemalaHeavily indebted poor countries (HIPC)High incomeHondurasHong Kong SAR, ChinaHungaryIcelandIDA blendIDA onlyIDA totalIndiaIndonesiaIran, Islamic Rep.IraqIrelandIsraelItalyJamaicaJapanJordanKazakhstanKenyaKiribatiKorea, Rep.KuwaitKyrgyz RepublicLao PDRLatin America & Caribbean Latin America & Caribbean (excluding high income)Latin America & the Caribbean (IDA & IBRD countries)LatviaLeast developed countries: UN classificationLebanonLesothoLiberiaLithuaniaLow incomeLower middle incomeLuxembourgMacao SAR, ChinaMacedonia, FYRMadagascarMalawiMalaysiaMaldivesMaliMaltaMauritiusMexicoMicronesia, Fed. Sts.Middle East & North Africa (excluding high income)Middle East & North Africa (IDA & IBRD countries)MoldovaMongoliaMoroccoMozambiqueMyanmarNamibiaNepalNetherlandsNew ZealandNicaraguaNigeriaNorth AmericaNorwayOECD membersOmanOther small statesPacific island small statesPakistanPanamaPapua New GuineaParaguayPeruPhilippinesPolandPortugalPost-demographic dividendPre-demographic dividendQatarRomaniaRussian FederationRwandaSamoaSan MarinoSao Tome and PrincipeSenegalSerbiaSeychellesSierra LeoneSingaporeSlovak RepublicSloveniaSmall statesSolomon IslandsSouth AfricaSouth AsiaSouth Asia (IDA & IBRD)SpainSri LankaSt. Kitts and NevisSt. LuciaSub-Saharan Africa Sub-Saharan Africa (excluding high income)Sub-Saharan Africa (IDA & IBRD countries)SurinameSwazilandSwedenSwitzerlandSyrian Arab RepublicTajikistanTanzaniaThailandTimor-LesteTogoTrinidad and TobagoTunisiaTurkeyUgandaUkraineUnited Arab EmiratesUnited KingdomUnited StatesUruguayVanuatuVenezuela, RBVietnamWest Bank and GazaWorldYemen, Rep.ZambiaZimbabwe Linha do tempo:
Nesta escala de tempo está apresentado um gráfico de 1973 ano até 2015 ano OECD members. Dados de 1972 ano ausente. O número de observações reais por data: 43.
Fonte (nome):
Indicadores de desenvolvimento mundial
Fonte (organização):
International Monetary Fund, Government Finance Statistics Yearbook and data files, and World Bank and OECD GDP estimates.
Categorias:
Economy & Growth, Public Sector
Foi atualizado:
23 abr 2017 ano
Indicadores de alterações dos valores ao longo dos anos
Mínimo:
18.843
1 jan 1973 ano
Máximo:
30.197
1 jan 2011 ano
Na data de observação
Valor
Mudança absoluta
A alteração em relação ao valor anterior
1 jan 1973 ano
18.843
+18.843
0.0%
1 jan 1974 ano
19.611
+0.768
4.08%
1 jan 1975 ano
20.41
+0.799
4.07%
1 jan 1976 ano
22.336
+1.926
9.44%
1 jan 1977 ano
22.679
+0.344
1.54%
1 jan 1978 ano
22.792
+0.113
0.5%
1 jan 1979 ano
23.177
+0.385
1.69%
1 jan 1980 ano
23.473
+0.295
1.27%
1 jan 1981 ano
24.458
+0.985
4.2%
1 jan 1982 ano
24.398
-0.06
-0.24%
1 jan 1983 ano
25.844
+1.446
5.93%
1 jan 1984 ano
25.888
+0.044
0.17%
1 jan 1985 ano
25.3
-0.588
-2.27%
1 jan 1986 ano
25.855
+0.555
2.19%
1 jan 1987 ano
26.767
+0.912
3.53%
1 jan 1988 ano
26.431
-0.336
-1.26%
1 jan 1989 ano
25.478
-0.953
-3.61%
1 jan 1990 ano
25.068
-0.41
-1.61%
1 jan 1991 ano
25.347
+0.279
1.11%
1 jan 1992 ano
28.382
+3.035
11.97%
1 jan 1993 ano
28.76
+0.379
1.33%
1 jan 1994 ano
29.116
+0.356
1.24%
1 jan 1995 ano
28.606
-0.51
-1.75%
1 jan 1996 ano
29.741
+1.136
3.97%
1 jan 1997 ano
28.955
-0.787
-2.65%
1 jan 1998 ano
27.764
-1.191
-4.11%
1 jan 1999 ano
26.948
-0.815
-2.94%
1 jan 2000 ano
26.491
-0.457
-1.7%
1 jan 2001 ano
26.071
-0.42
-1.59%
1 jan 2002 ano
27.198
+1.126
4.32%
1 jan 2003 ano
27.529
+0.331
1.22%
1 jan 2004 ano
28.07
+0.542
1.97%
1 jan 2005 ano
27.692
-0.378
-1.35%
1 jan 2006 ano
26.411
-1.281
-4.63%
1 jan 2007 ano
26.052
-0.359
-1.36%
1 jan 2008 ano
25.806
-0.246
-0.94%
1 jan 2009 ano
27.201
+1.395
5.41%
1 jan 2010 ano
30.169
+2.967
10.91%
1 jan 2011 ano
30.197
+0.029
0.09%
1 jan 2012 ano
29.533
-0.664
-2.2%
1 jan 2013 ano
29.475
-0.059
-0.2%
1 jan 2014 ano
28.96
-0.515
-1.75%
1 jan 2015 ano
30.092
+1.132
3.91%
Classificação de países por estatísticas atuais por anos


Comentários: