29
/pt/
pt
AIzaSyAYiBZKx7MnpbEhh9jyipgxe19OcubqV5w
April 1, 2024
275629
United Kingdom
GBR
true
2
1
Expense (% of GDP)
2015,2014,2013,2012,2011,2010,2009,2008,2007,2006,2005,2004,2003,2002,2001,2000,1999,1998,1997,1996,1995,1994,1993,1992,1991,1990,1989,1988,1987,1986,1985,1984,1983,1982,1981,1980,1979,1978,1977,1976,1975,1974,1973
Estas estatísticas em outros países:
AfghanistanAlbaniaAlgeriaAngolaAntigua and BarbudaArmeniaAustraliaAustriaAzerbaijanBahamas, TheBahrainBangladeshBarbadosBelarusBelgiumBelizeBeninBhutanBoliviaBosnia and HerzegovinaBotswanaBrazilBulgariaBurkina FasoBurundiCabo VerdeCambodiaCanadaCaribbean small statesCentral African RepublicCentral Europe and the BalticsChileColombiaCongo, Dem. Rep.Congo, Rep.Costa RicaCote d'IvoireCroatiaCyprusCzech RepublicDenmarkDominicaDominican RepublicEarly-demographic dividendEgypt, Arab Rep.El SalvadorEquatorial GuineaEstoniaEthiopiaEuro areaEurope & Central AsiaEurope & Central Asia (excluding high income)Europe & Central Asia (IDA & IBRD countries)European UnionFijiFinlandFranceGambia, TheGeorgiaGermanyGhanaGreeceGrenadaGuatemalaHeavily indebted poor countries (HIPC)High incomeHondurasHong Kong SAR, ChinaHungaryIcelandIDA blendIDA onlyIDA totalIndiaIndonesiaIran, Islamic Rep.IraqIrelandIsraelItalyJamaicaJapanJordanKazakhstanKenyaKiribatiKorea, Rep.KuwaitKyrgyz RepublicLao PDRLatin America & Caribbean Latin America & Caribbean (excluding high income)Latin America & the Caribbean (IDA & IBRD countries)LatviaLeast developed countries: UN classificationLebanonLesothoLiberiaLithuaniaLow incomeLower middle incomeLuxembourgMacao SAR, ChinaMacedonia, FYRMadagascarMalawiMalaysiaMaldivesMaliMaltaMauritiusMexicoMicronesia, Fed. Sts.Middle East & North Africa (excluding high income)Middle East & North Africa (IDA & IBRD countries)MoldovaMongoliaMoroccoMozambiqueMyanmarNamibiaNepalNetherlandsNew ZealandNicaraguaNigeriaNorth AmericaNorwayOECD membersOmanOther small statesPacific island small statesPakistanPanamaPapua New GuineaParaguayPeruPhilippinesPolandPortugalPost-demographic dividendPre-demographic dividendQatarRomaniaRussian FederationRwandaSamoaSan MarinoSao Tome and PrincipeSenegalSerbiaSeychellesSierra LeoneSingaporeSlovak RepublicSloveniaSmall statesSolomon IslandsSouth AfricaSouth AsiaSouth Asia (IDA & IBRD)SpainSri LankaSt. Kitts and NevisSt. LuciaSub-Saharan Africa Sub-Saharan Africa (excluding high income)Sub-Saharan Africa (IDA & IBRD countries)SurinameSwazilandSwedenSwitzerlandSyrian Arab RepublicTajikistanTanzaniaThailandTimor-LesteTogoTrinidad and TobagoTunisiaTurkeyUgandaUkraineUnited Arab EmiratesUnited KingdomUnited StatesUruguayVanuatuVenezuela, RBVietnamWest Bank and GazaWorldYemen, Rep.ZambiaZimbabwe Linha do tempo:
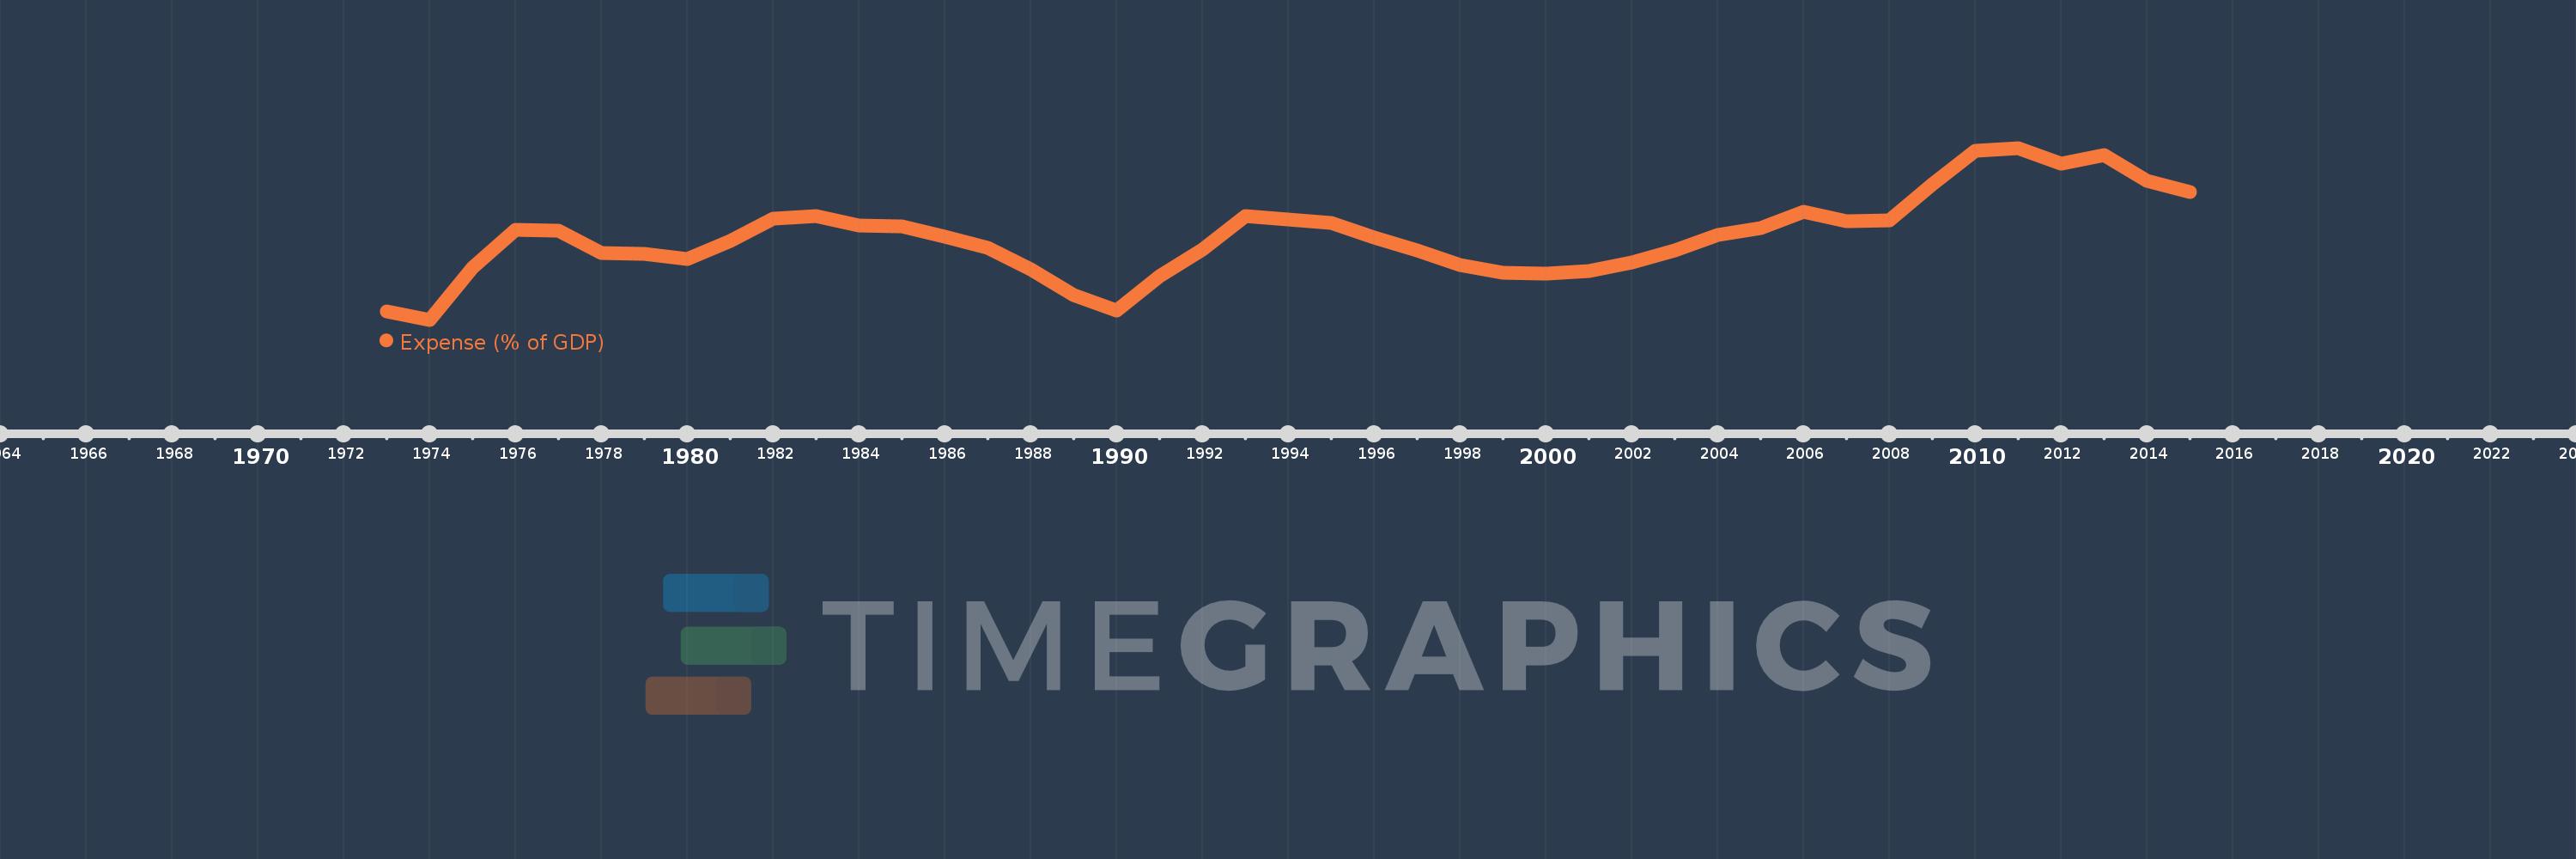
Nesta escala de tempo está apresentado um gráfico de 1973 ano até 2015 ano United Kingdom. Dados de 1972 ano ausente. O número de observações reais por data: 43.
Fonte (nome):
Indicadores de desenvolvimento mundial
Fonte (organização):
International Monetary Fund, Government Finance Statistics Yearbook and data files, and World Bank and OECD GDP estimates.
Categorias:
Economy & Growth, Public Sector
Foi atualizado:
23 abr 2017 ano
Indicadores de alterações dos valores ao longo dos anos
Mínimo:
28.838
1 jan 1974 ano
Máximo:
43.479
1 jan 2011 ano
Na data de observação
Valor
Mudança absoluta
A alteração em relação ao valor anterior
1 jan 1973 ano
29.512
+29.512
0.0%
1 jan 1974 ano
28.838
-0.674
-2.28%
1 jan 1975 ano
33.254
+4.415
15.31%
1 jan 1976 ano
36.489
+3.235
9.73%
1 jan 1977 ano
36.445
-0.044
-0.12%
1 jan 1978 ano
34.528
-1.917
-5.26%
1 jan 1979 ano
34.489
-0.039
-0.11%
1 jan 1980 ano
33.98
-0.509
-1.48%
1 jan 1981 ano
35.56
+1.58
4.65%
1 jan 1982 ano
37.484
+1.925
5.41%
1 jan 1983 ano
37.672
+0.187
0.5%
1 jan 1984 ano
36.882
-0.79
-2.1%
1 jan 1985 ano
36.82
-0.062
-0.17%
1 jan 1986 ano
35.933
-0.887
-2.41%
1 jan 1987 ano
34.978
-0.955
-2.66%
1 jan 1988 ano
33.137
-1.84
-5.26%
1 jan 1989 ano
30.972
-2.165
-6.53%
1 jan 1990 ano
29.655
-1.318
-4.25%
1 jan 1991 ano
32.583
+2.928
9.88%
1 jan 1992 ano
34.784
+2.201
6.76%
1 jan 1993 ano
37.641
+2.857
8.21%
1 jan 1994 ano
37.369
-0.272
-0.72%
1 jan 1995 ano
37.08
-0.289
-0.77%
1 jan 1996 ano
35.826
-1.254
-3.38%
1 jan 1997 ano
34.719
-1.107
-3.09%
1 jan 1998 ano
33.521
-1.198
-3.45%
1 jan 1999 ano
32.85
-0.671
-2.0%
1 jan 2000 ano
32.775
-0.075
-0.23%
1 jan 2001 ano
33.018
+0.242
0.74%
1 jan 2002 ano
33.72
+0.703
2.13%
1 jan 2003 ano
34.749
+1.029
3.05%
1 jan 2004 ano
36.054
+1.304
3.75%
1 jan 2005 ano
36.633
+0.579
1.61%
1 jan 2006 ano
38.029
+1.396
3.81%
1 jan 2007 ano
37.241
-0.788
-2.07%
1 jan 2008 ano
37.29
+0.049
0.13%
1 jan 2009 ano
40.393
+3.103
8.32%
1 jan 2010 ano
43.204
+2.811
6.96%
1 jan 2011 ano
43.479
+0.274
0.63%
1 jan 2012 ano
42.173
-1.305
-3.0%
1 jan 2013 ano
42.874
+0.701
1.66%
1 jan 2014 ano
40.662
-2.212
-5.16%
1 jan 2015 ano
39.728
-0.934
-2.3%
Classificação de países por estatísticas atuais por anos


Comentários: