29
/pt/
pt
AIzaSyAYiBZKx7MnpbEhh9jyipgxe19OcubqV5w
April 1, 2024
29811
Euro area
EMU
false
2
1
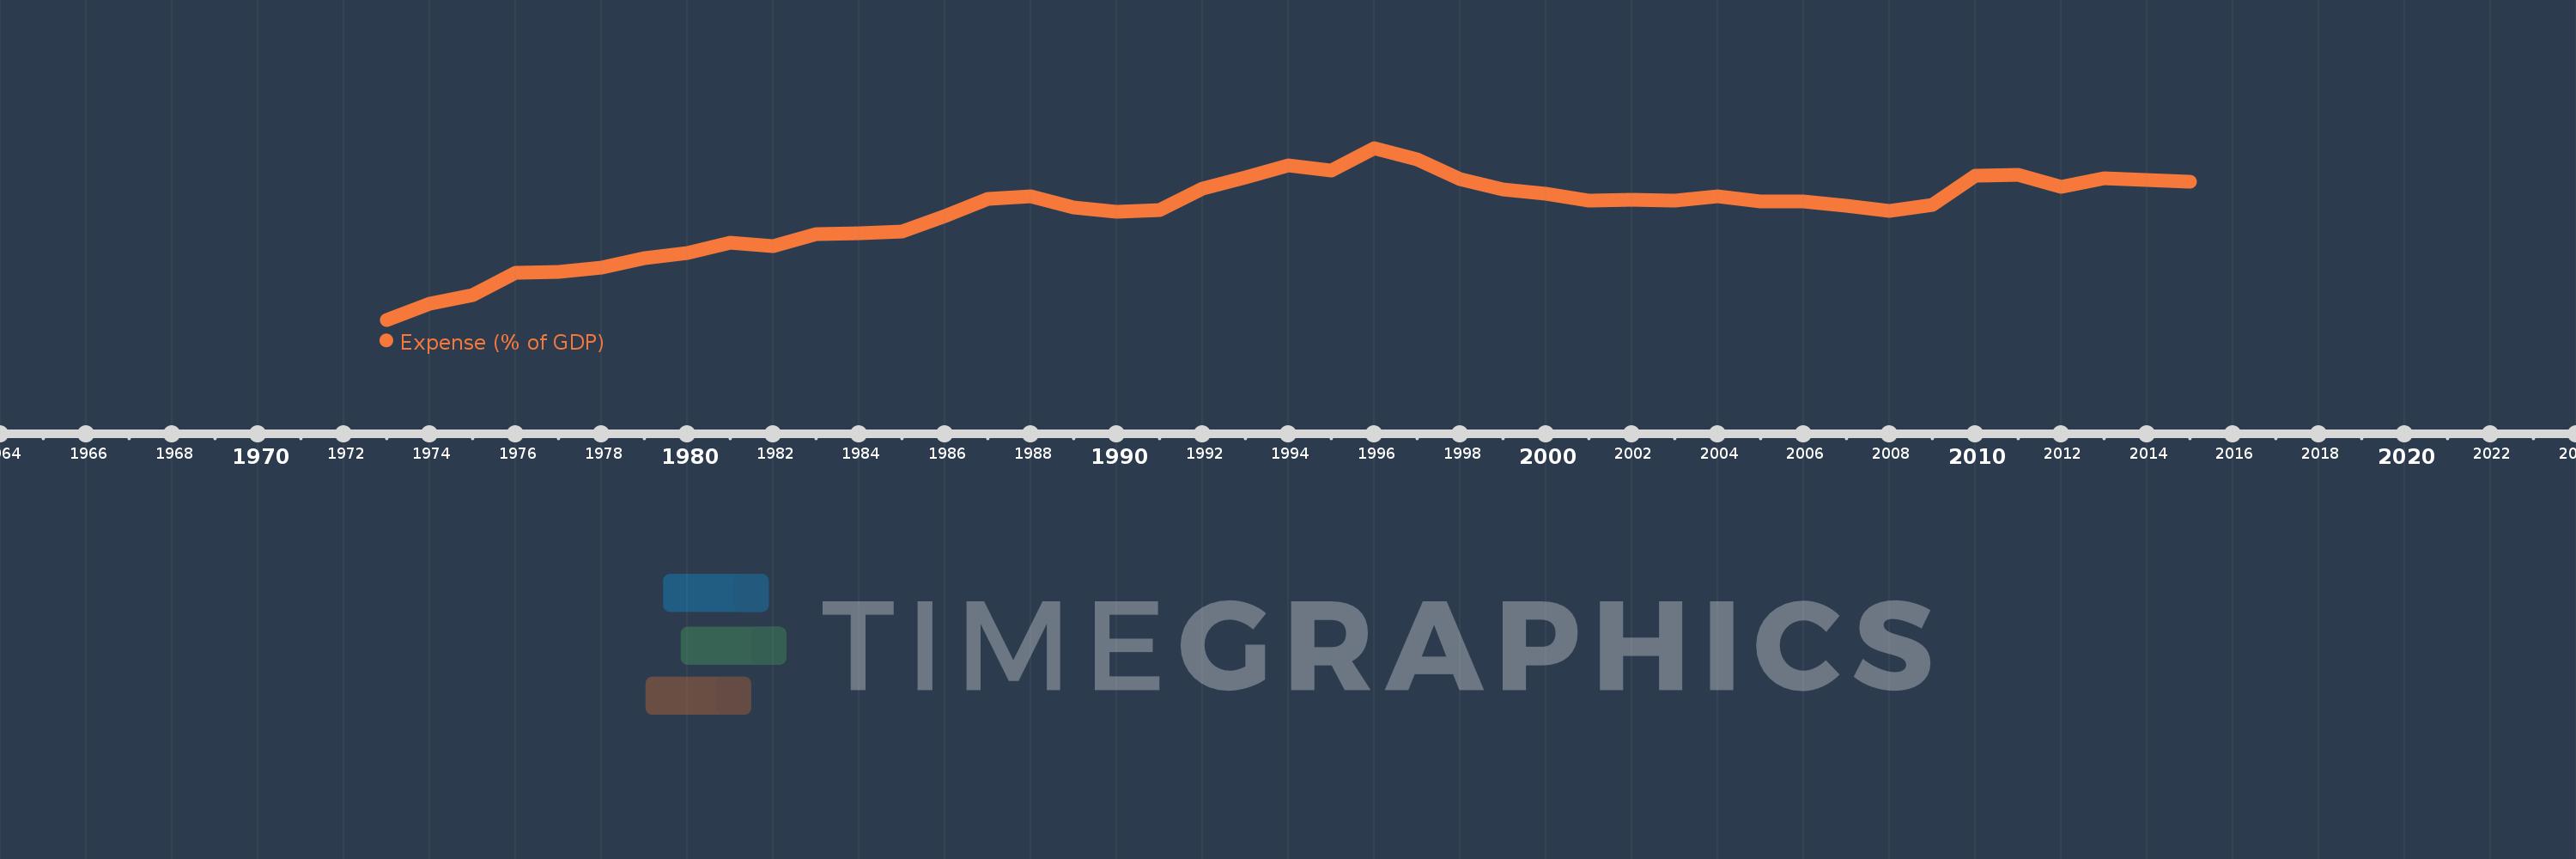
Expense (% of GDP)
2015,2014,2013,2012,2011,2010,2009,2008,2007,2006,2005,2004,2003,2002,2001,2000,1999,1998,1997,1996,1995,1994,1993,1992,1991,1990,1989,1988,1987,1986,1985,1984,1983,1982,1981,1980,1979,1978,1977,1976,1975,1974,1973
Estas estatísticas em outros países:
AfghanistanAlbaniaAlgeriaAngolaAntigua and BarbudaArmeniaAustraliaAustriaAzerbaijanBahamas, TheBahrainBangladeshBarbadosBelarusBelgiumBelizeBeninBhutanBoliviaBosnia and HerzegovinaBotswanaBrazilBulgariaBurkina FasoBurundiCabo VerdeCambodiaCanadaCaribbean small statesCentral African RepublicCentral Europe and the BalticsChileColombiaCongo, Dem. Rep.Congo, Rep.Costa RicaCote d'IvoireCroatiaCyprusCzech RepublicDenmarkDominicaDominican RepublicEarly-demographic dividendEgypt, Arab Rep.El SalvadorEquatorial GuineaEstoniaEthiopiaEuro areaEurope & Central AsiaEurope & Central Asia (excluding high income)Europe & Central Asia (IDA & IBRD countries)European UnionFijiFinlandFranceGambia, TheGeorgiaGermanyGhanaGreeceGrenadaGuatemalaHeavily indebted poor countries (HIPC)High incomeHondurasHong Kong SAR, ChinaHungaryIcelandIDA blendIDA onlyIDA totalIndiaIndonesiaIran, Islamic Rep.IraqIrelandIsraelItalyJamaicaJapanJordanKazakhstanKenyaKiribatiKorea, Rep.KuwaitKyrgyz RepublicLao PDRLatin America & Caribbean Latin America & Caribbean (excluding high income)Latin America & the Caribbean (IDA & IBRD countries)LatviaLeast developed countries: UN classificationLebanonLesothoLiberiaLithuaniaLow incomeLower middle incomeLuxembourgMacao SAR, ChinaMacedonia, FYRMadagascarMalawiMalaysiaMaldivesMaliMaltaMauritiusMexicoMicronesia, Fed. Sts.Middle East & North Africa (excluding high income)Middle East & North Africa (IDA & IBRD countries)MoldovaMongoliaMoroccoMozambiqueMyanmarNamibiaNepalNetherlandsNew ZealandNicaraguaNigeriaNorth AmericaNorwayOECD membersOmanOther small statesPacific island small statesPakistanPanamaPapua New GuineaParaguayPeruPhilippinesPolandPortugalPost-demographic dividendPre-demographic dividendQatarRomaniaRussian FederationRwandaSamoaSan MarinoSao Tome and PrincipeSenegalSerbiaSeychellesSierra LeoneSingaporeSlovak RepublicSloveniaSmall statesSolomon IslandsSouth AfricaSouth AsiaSouth Asia (IDA & IBRD)SpainSri LankaSt. Kitts and NevisSt. LuciaSub-Saharan Africa Sub-Saharan Africa (excluding high income)Sub-Saharan Africa (IDA & IBRD countries)SurinameSwazilandSwedenSwitzerlandSyrian Arab RepublicTajikistanTanzaniaThailandTimor-LesteTogoTrinidad and TobagoTunisiaTurkeyUgandaUkraineUnited Arab EmiratesUnited KingdomUnited StatesUruguayVanuatuVenezuela, RBVietnamWest Bank and GazaWorldYemen, Rep.ZambiaZimbabwe Linha do tempo:
Nesta escala de tempo está apresentado um gráfico de 1973 ano até 2015 ano Euro area. Dados de 1972 ano ausente. O número de observações reais por data: 43.
Fonte (nome):
Indicadores de desenvolvimento mundial
Fonte (organização):
International Monetary Fund, Government Finance Statistics Yearbook and data files, and World Bank and OECD GDP estimates.
Categorias:
Economy & Growth, Public Sector
Foi atualizado:
23 abr 2017 ano
Indicadores de alterações dos valores ao longo dos anos
Mínimo:
21.678
1 jan 1973 ano
Máximo:
41.74
1 jan 1996 ano
Na data de observação
Valor
Mudança absoluta
A alteração em relação ao valor anterior
1 jan 1973 ano
21.678
+21.678
0.0%
1 jan 1974 ano
23.522
+1.844
8.51%
1 jan 1975 ano
24.593
+1.071
4.55%
1 jan 1976 ano
27.199
+2.606
10.6%
1 jan 1977 ano
27.267
+0.068
0.25%
1 jan 1978 ano
27.722
+0.454
1.67%
1 jan 1979 ano
28.894
+1.173
4.23%
1 jan 1980 ano
29.441
+0.547
1.89%
1 jan 1981 ano
30.678
+1.237
4.2%
1 jan 1982 ano
30.313
-0.366
-1.19%
1 jan 1983 ano
31.661
+1.349
4.45%
1 jan 1984 ano
31.797
+0.136
0.43%
1 jan 1985 ano
32.008
+0.211
0.67%
1 jan 1986 ano
33.813
+1.804
5.64%
1 jan 1987 ano
35.776
+1.963
5.81%
1 jan 1988 ano
36.134
+0.358
1.0%
1 jan 1989 ano
34.77
-1.364
-3.77%
1 jan 1990 ano
34.307
-0.464
-1.33%
1 jan 1991 ano
34.528
+0.221
0.64%
1 jan 1992 ano
37.028
+2.5
7.24%
1 jan 1993 ano
38.331
+1.304
3.52%
1 jan 1994 ano
39.682
+1.351
3.52%
1 jan 1995 ano
39.056
-0.626
-1.58%
1 jan 1996 ano
41.74
+2.684
6.87%
1 jan 1997 ano
40.413
-1.327
-3.18%
1 jan 1998 ano
38.102
-2.311
-5.72%
1 jan 1999 ano
36.877
-1.225
-3.22%
1 jan 2000 ano
36.358
-0.519
-1.41%
1 jan 2001 ano
35.547
-0.811
-2.23%
1 jan 2002 ano
35.719
+0.173
0.49%
1 jan 2003 ano
35.608
-0.112
-0.31%
1 jan 2004 ano
36.044
+0.437
1.23%
1 jan 2005 ano
35.51
-0.534
-1.48%
1 jan 2006 ano
35.487
-0.023
-0.07%
1 jan 2007 ano
35.013
-0.474
-1.34%
1 jan 2008 ano
34.384
-0.629
-1.8%
1 jan 2009 ano
35.121
+0.737
2.14%
1 jan 2010 ano
38.504
+3.384
9.63%
1 jan 2011 ano
38.624
+0.12
0.31%
1 jan 2012 ano
37.241
-1.383
-3.58%
1 jan 2013 ano
38.18
+0.939
2.52%
1 jan 2014 ano
38.034
-0.146
-0.38%
1 jan 2015 ano
37.785
-0.249
-0.65%
Classificação de países por estatísticas atuais por anos


Comentários: