29
/pt/
pt
AIzaSyAYiBZKx7MnpbEhh9jyipgxe19OcubqV5w
April 1, 2024
49379
Middle East & North Africa (excluding high income)
MNA
false
2
1
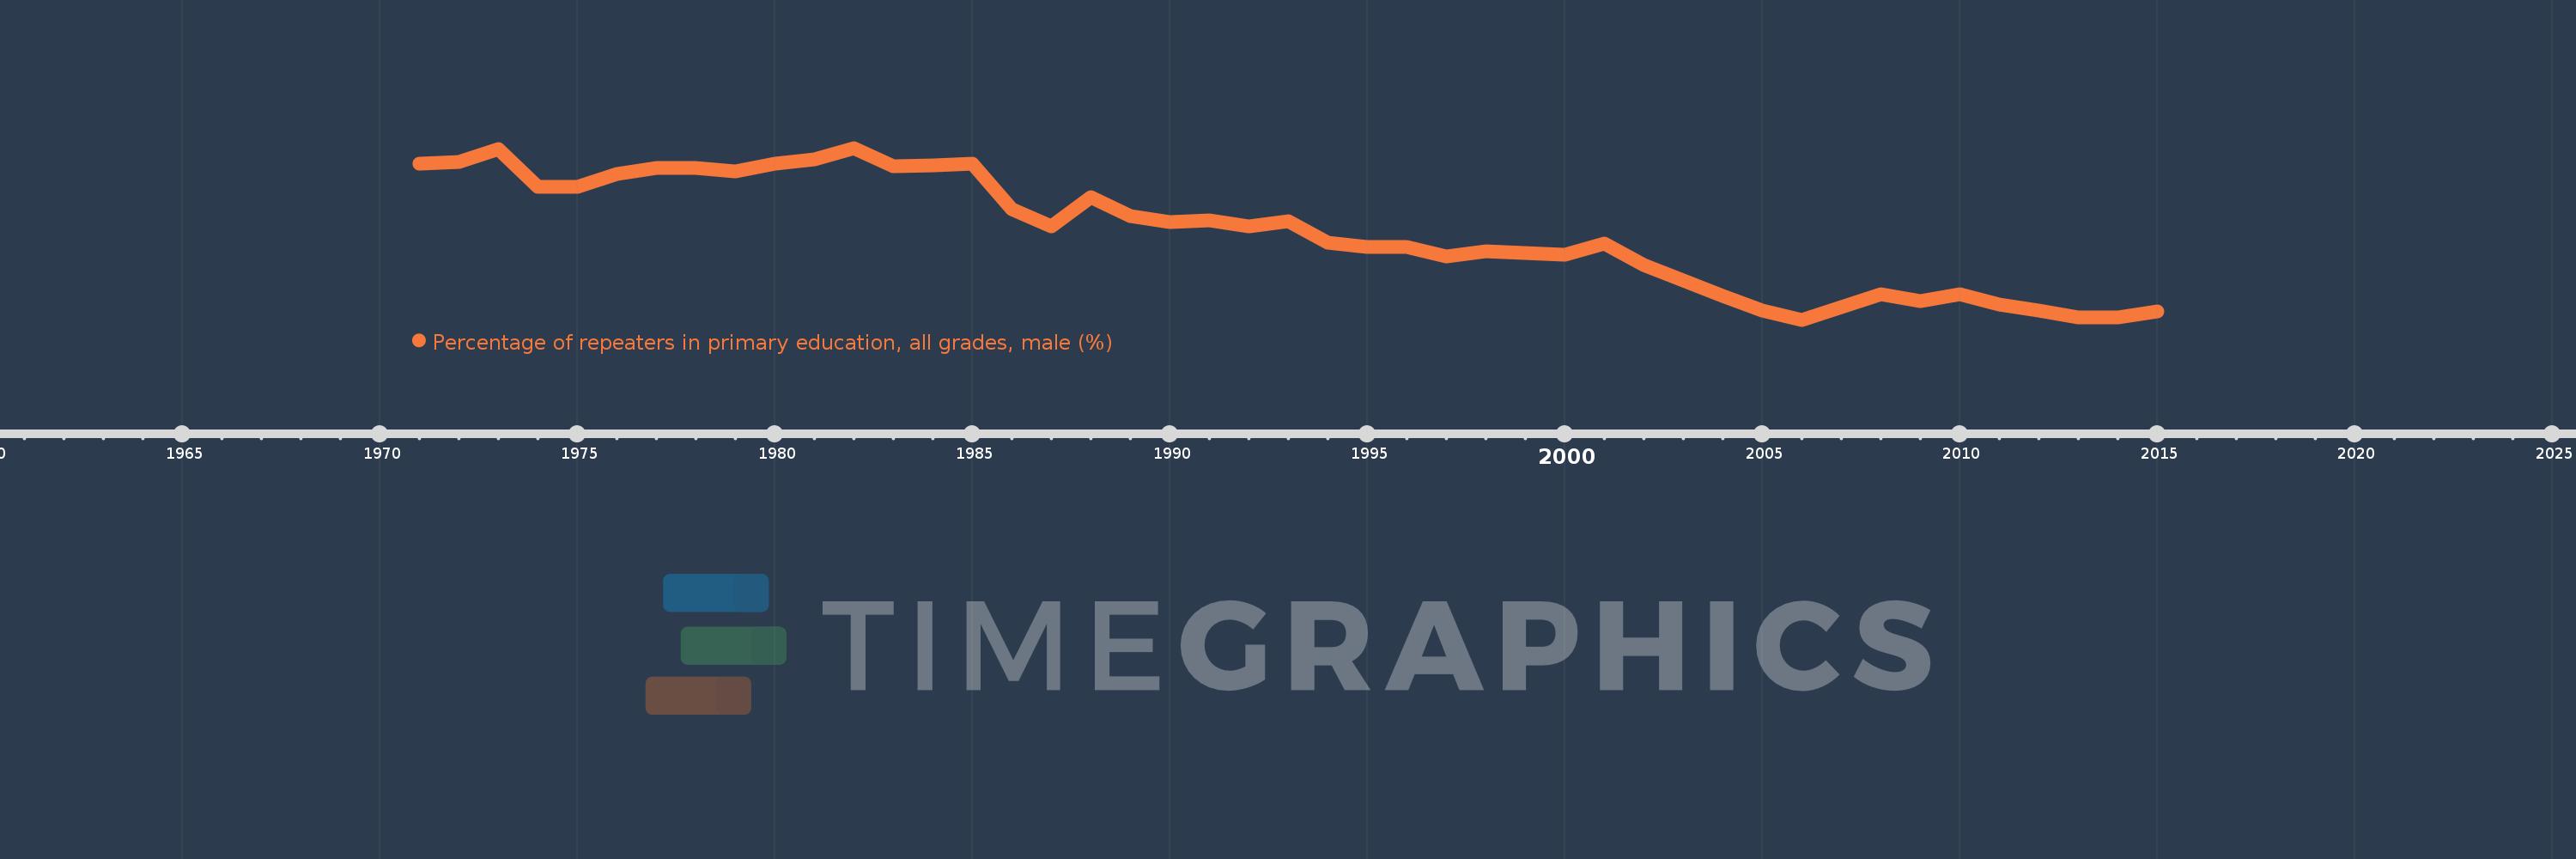
Percentage of repeaters in primary education, all grades, male (%)
2015,2014,2013,2012,2011,2010,2009,2008,2007,2006,2005,2004,2003,2002,2001,2000,1999,1998,1997,1996,1995,1994,1993,1992,1991,1990,1989,1988,1987,1986,1985,1984,1983,1982,1981,1980,1979,1978,1977,1976,1975,1974,1973,1972,1971
Estas estatísticas em outros países:
AfghanistanAlbaniaAlgeriaAndorraAngolaAntigua and BarbudaArab WorldArgentinaArmeniaArubaAustriaAzerbaijanBahamas, TheBahrainBangladeshBelarusBelgiumBelizeBeninBermudaBhutanBoliviaBosnia and HerzegovinaBotswanaBrazilBritish Virgin IslandsBrunei DarussalamBulgariaBurkina FasoBurundiCabo VerdeCambodiaCameroonCanadaCaribbean small statesCayman IslandsCentral African RepublicCentral Europe and the BalticsChadChileChinaColombiaComorosCongo, Dem. Rep.Congo, Rep.Costa RicaCote d'IvoireCroatiaCubaCyprusCzech RepublicDenmarkDjiboutiDominicaDominican RepublicEarly-demographic dividendEast Asia & PacificEast Asia & Pacific (excluding high income)East Asia & Pacific (IDA & IBRD countries)EcuadorEgypt, Arab Rep.El SalvadorEquatorial GuineaEritreaEstoniaEthiopiaEuro areaEurope & Central AsiaEurope & Central Asia (excluding high income)Europe & Central Asia (IDA & IBRD countries)European UnionFijiFinlandFragile and conflict affected situationsFranceGabonGambia, TheGeorgiaGermanyGhanaGreeceGrenadaGuatemalaGuineaGuinea-BissauGuyanaHaitiHeavily indebted poor countries (HIPC)High incomeHondurasHong Kong SAR, ChinaHungaryIBRD onlyIcelandIDA & IBRD totalIDA blendIDA onlyIDA totalIndiaIndonesiaIran, Islamic Rep.IraqIrelandIsraelItalyJamaicaJapanJordanKazakhstanKenyaKiribatiKorea, Rep.KuwaitKyrgyz RepublicLao PDRLate-demographic dividendLatin America & Caribbean Latin America & Caribbean (excluding high income)Latin America & the Caribbean (IDA & IBRD countries)LatviaLeast developed countries: UN classificationLebanonLesothoLiberiaLibyaLiechtensteinLithuaniaLow & middle incomeLow incomeLower middle incomeLuxembourgMacao SAR, ChinaMacedonia, FYRMadagascarMalawiMalaysiaMaldivesMaliMaltaMauritaniaMauritiusMexicoMiddle East & North AfricaMiddle East & North Africa (excluding high income)Middle East & North Africa (IDA & IBRD countries)Middle incomeMoldovaMonacoMongoliaMontenegroMoroccoMozambiqueMyanmarNamibiaNauruNepalNetherlandsNew ZealandNicaraguaNigerNorwayOECD membersOmanOther small statesPacific island small statesPakistanPalauPanamaPapua New GuineaParaguayPeruPhilippinesPolandPortugalPost-demographic dividendPre-demographic dividendQatarRomaniaRussian FederationRwandaSamoaSan MarinoSao Tome and PrincipeSaudi ArabiaSenegalSerbiaSeychellesSierra LeoneSingaporeSint Maarten (Dutch part)Slovak RepublicSloveniaSmall statesSolomon IslandsSomaliaSouth AfricaSouth AsiaSouth Asia (IDA & IBRD)South SudanSpainSri LankaSt. Kitts and NevisSt. LuciaSt. Vincent and the GrenadinesSub-Saharan Africa Sub-Saharan Africa (excluding high income)Sub-Saharan Africa (IDA & IBRD countries)SudanSurinameSwazilandSwedenSwitzerlandSyrian Arab RepublicTajikistanTanzaniaThailandTimor-LesteTogoTongaTrinidad and TobagoTunisiaTurkeyTurks and Caicos IslandsTuvaluUgandaUkraineUnited Arab EmiratesUnited KingdomUpper middle incomeUruguayUzbekistanVanuatuVenezuela, RBVietnamWest Bank and GazaWorldYemen, Rep.ZambiaZimbabwe Linha do tempo:
Nesta escala de tempo está apresentado um gráfico de 1971 ano até 2015 ano Middle East & North Africa (excluding high income). Dados de 1970 ano ausente. O número de observações reais por data: 45.
Fonte (nome):
Indicadores de desenvolvimento mundial
Fonte (organização):
UNESCO Institute for Statistics
Categorias:
Education, Gender
Foi atualizado:
23 abr 2017 ano
Indicadores de alterações dos valores ao longo dos anos
Mínimo:
7.483
1 jan 2006 ano
Máximo:
13.615
1 jan 1982 ano
Na data de observação
Valor
Mudança absoluta
A alteração em relação ao valor anterior
1 jan 1971 ano
13.04
+13.04
0.0%
1 jan 1972 ano
13.109
+0.069
0.53%
1 jan 1973 ano
13.577
+0.467
3.56%
1 jan 1974 ano
12.233
-1.343
-9.9%
1 jan 1975 ano
12.229
-0.004
-0.03%
1 jan 1976 ano
12.684
+0.455
3.72%
1 jan 1977 ano
12.886
+0.202
1.59%
1 jan 1978 ano
12.901
+0.015
0.12%
1 jan 1979 ano
12.776
-0.125
-0.97%
1 jan 1980 ano
13.067
+0.291
2.28%
1 jan 1981 ano
13.219
+0.152
1.16%
1 jan 1982 ano
13.615
+0.396
3.0%
1 jan 1983 ano
12.975
-0.639
-4.7%
1 jan 1984 ano
13.007
+0.032
0.25%
1 jan 1985 ano
13.051
+0.043
0.33%
1 jan 1986 ano
11.441
-1.61
-12.34%
1 jan 1987 ano
10.817
-0.624
-5.46%
1 jan 1988 ano
11.862
+1.045
9.66%
1 jan 1989 ano
11.172
-0.689
-5.81%
1 jan 1990 ano
10.981
-0.192
-1.71%
1 jan 1991 ano
11.035
+0.055
0.5%
1 jan 1992 ano
10.829
-0.206
-1.87%
1 jan 1993 ano
10.998
+0.169
1.56%
1 jan 1994 ano
10.248
-0.75
-6.82%
1 jan 1995 ano
10.07
-0.178
-1.74%
1 jan 1996 ano
10.081
+0.011
0.11%
1 jan 1997 ano
9.756
-0.325
-3.23%
1 jan 1998 ano
9.928
+0.172
1.77%
1 jan 1999 ano
9.88
-0.048
-0.48%
1 jan 2000 ano
9.812
-0.068
-0.69%
1 jan 2001 ano
10.188
+0.376
3.83%
1 jan 2002 ano
9.432
-0.756
-7.42%
1 jan 2003 ano
8.898
-0.534
-5.67%
1 jan 2004 ano
8.336
-0.562
-6.31%
1 jan 2005 ano
7.825
-0.511
-6.13%
1 jan 2006 ano
7.483
-0.342
-4.37%
1 jan 2007 ano
7.941
+0.458
6.12%
1 jan 2008 ano
8.398
+0.457
5.75%
1 jan 2009 ano
8.145
-0.253
-3.01%
1 jan 2010 ano
8.39
+0.244
3.0%
1 jan 2011 ano
8.027
-0.363
-4.32%
1 jan 2012 ano
7.805
-0.221
-2.76%
1 jan 2013 ano
7.576
-0.229
-2.94%
1 jan 2014 ano
7.572
-0.004
-0.05%
1 jan 2015 ano
7.783
+0.211
2.79%
Classificação de países por estatísticas atuais por anos


Comentários: