30
/pt/
AIzaSyAYiBZKx7MnpbEhh9jyipgxe19OcubqV5w
April 1, 2024
125278
Egypt, Arab Rep.
EGY
true
2
1
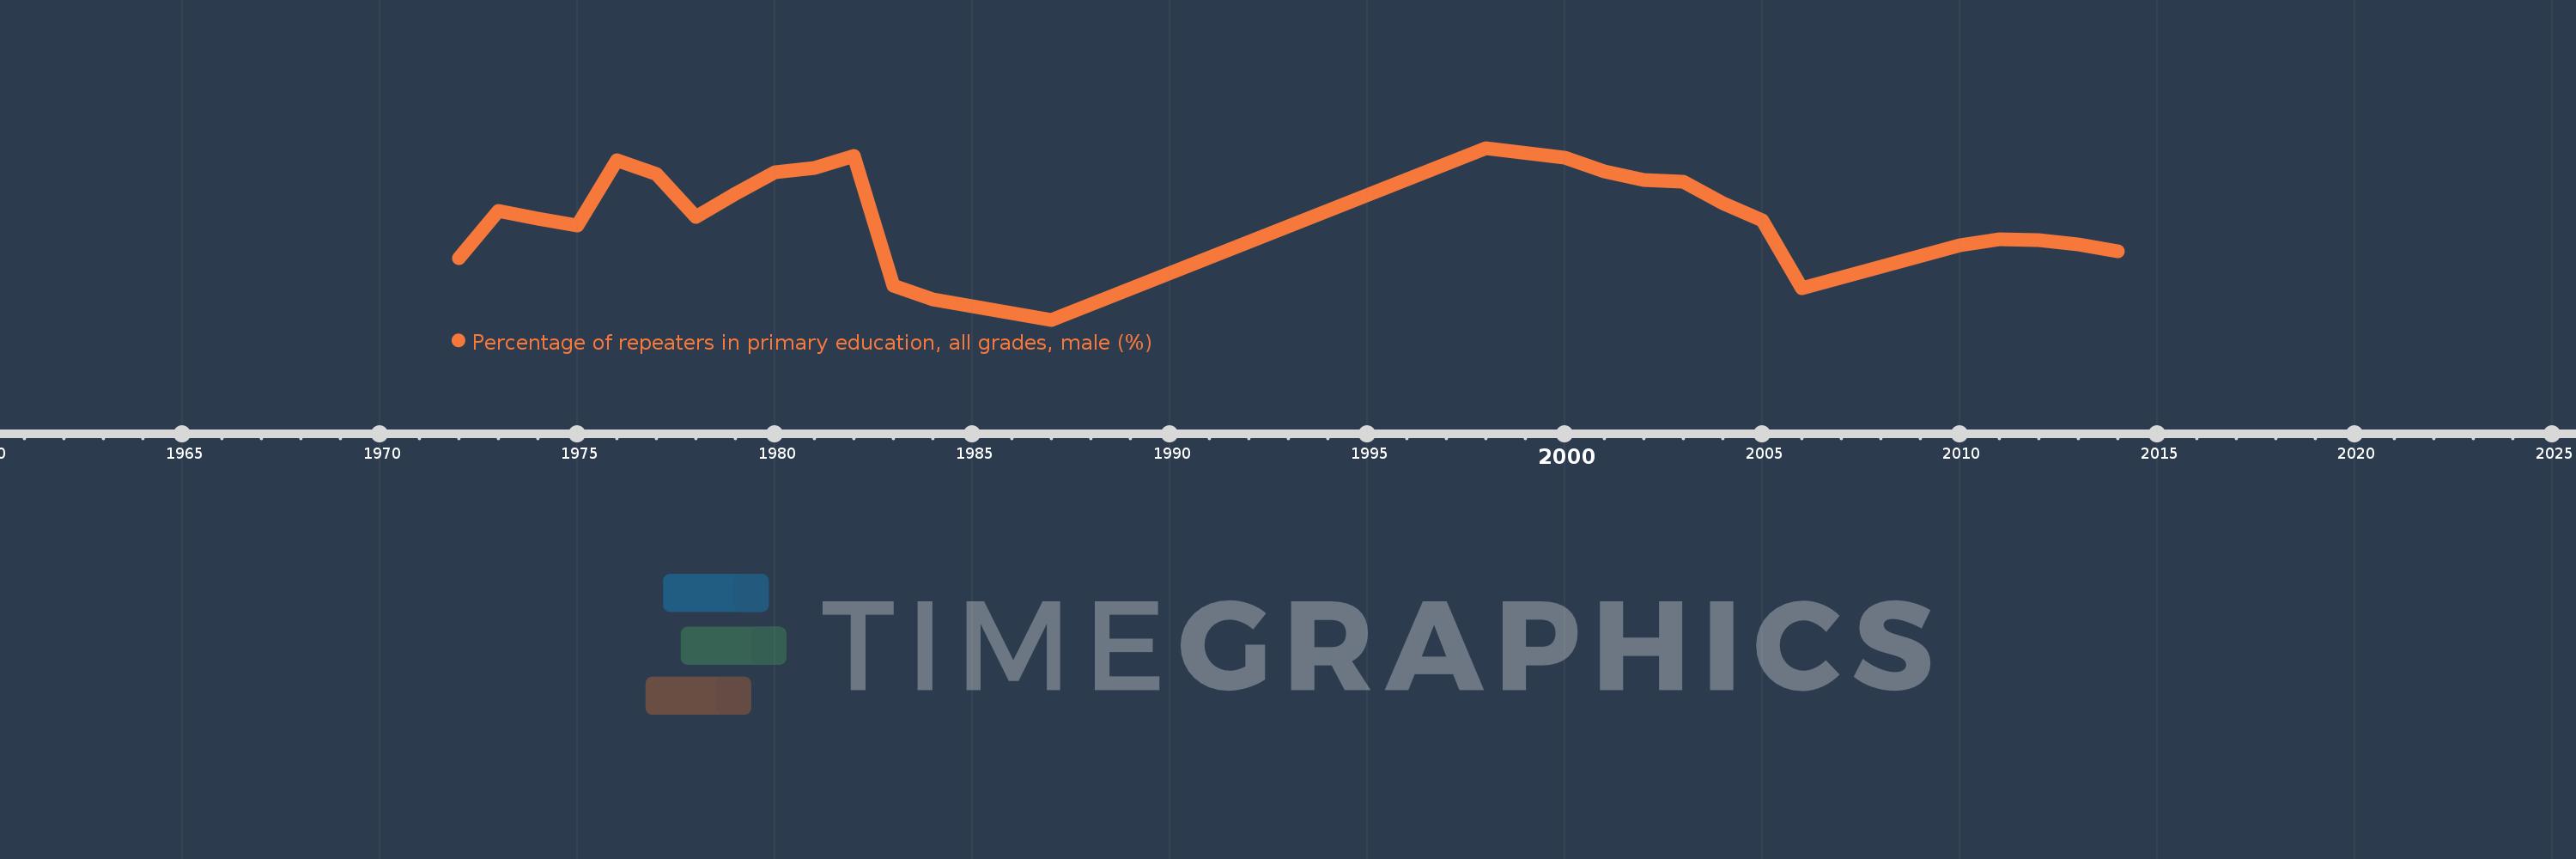
Percentage of repeaters in primary education, all grades, male (%)
2014,2013,2012,2011,2010,2006,2005,2004,2003,2002,2001,2000,1998,1987,1984,1983,1982,1981,1980,1979,1978,1977,1976,1975,1974,1973,1972
