29
/pt/
pt
AIzaSyAYiBZKx7MnpbEhh9jyipgxe19OcubqV5w
April 1, 2024
126664
El Salvador
SLV
true
2
1
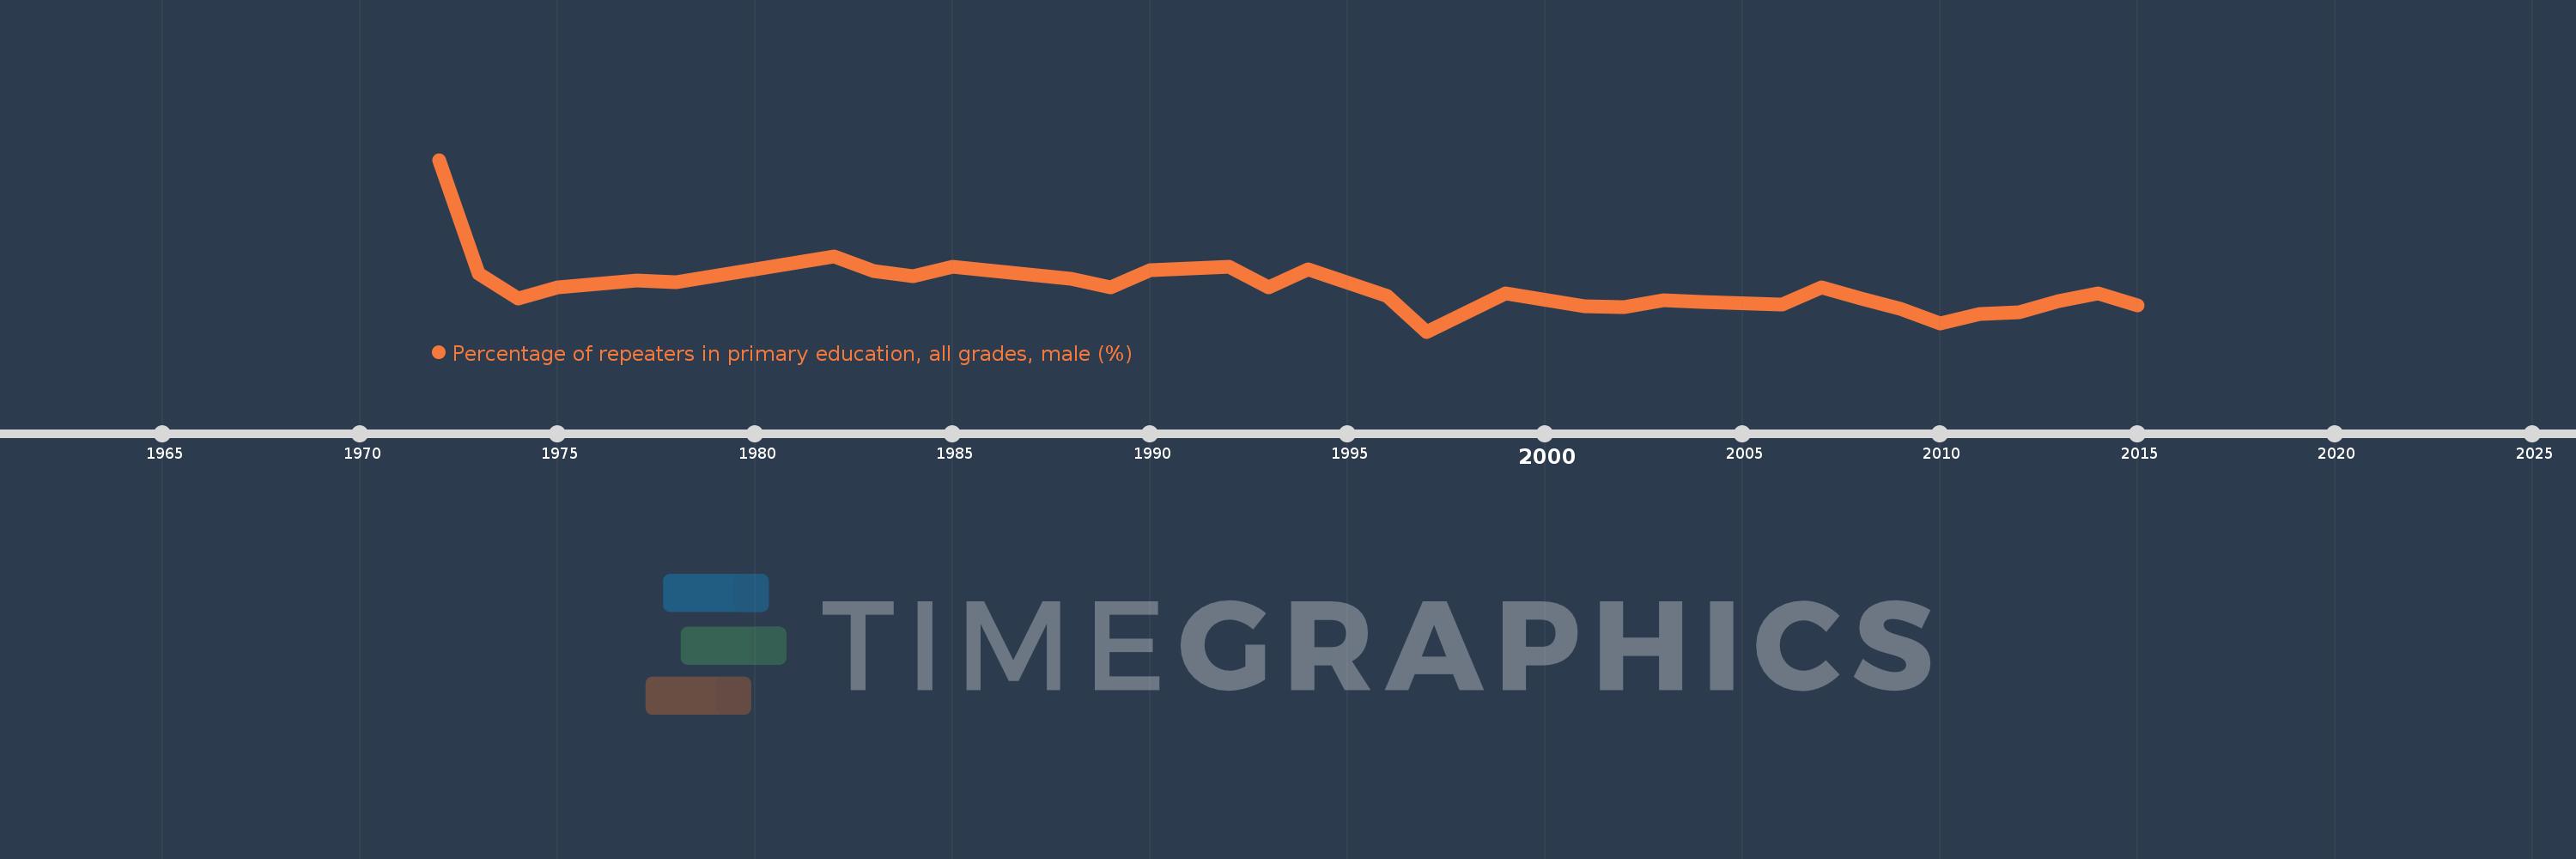
Percentage of repeaters in primary education, all grades, male (%)
2015,2014,2013,2012,2011,2010,2009,2008,2007,2006,2004,2003,2002,2001,1999,1997,1996,1994,1993,1992,1990,1989,1988,1985,1984,1983,1982,1978,1977,1975,1974,1973,1972
Estas estatísticas em outros países:
AfghanistanAlbaniaAlgeriaAndorraAngolaAntigua and BarbudaArab WorldArgentinaArmeniaArubaAustriaAzerbaijanBahamas, TheBahrainBangladeshBelarusBelgiumBelizeBeninBermudaBhutanBoliviaBosnia and HerzegovinaBotswanaBrazilBritish Virgin IslandsBrunei DarussalamBulgariaBurkina FasoBurundiCabo VerdeCambodiaCameroonCanadaCaribbean small statesCayman IslandsCentral African RepublicCentral Europe and the BalticsChadChileChinaColombiaComorosCongo, Dem. Rep.Congo, Rep.Costa RicaCote d'IvoireCroatiaCubaCyprusCzech RepublicDenmarkDjiboutiDominicaDominican RepublicEarly-demographic dividendEast Asia & PacificEast Asia & Pacific (excluding high income)East Asia & Pacific (IDA & IBRD countries)EcuadorEgypt, Arab Rep.El SalvadorEquatorial GuineaEritreaEstoniaEthiopiaEuro areaEurope & Central AsiaEurope & Central Asia (excluding high income)Europe & Central Asia (IDA & IBRD countries)European UnionFijiFinlandFragile and conflict affected situationsFranceGabonGambia, TheGeorgiaGermanyGhanaGreeceGrenadaGuatemalaGuineaGuinea-BissauGuyanaHaitiHeavily indebted poor countries (HIPC)High incomeHondurasHong Kong SAR, ChinaHungaryIBRD onlyIcelandIDA & IBRD totalIDA blendIDA onlyIDA totalIndiaIndonesiaIran, Islamic Rep.IraqIrelandIsraelItalyJamaicaJapanJordanKazakhstanKenyaKiribatiKorea, Rep.KuwaitKyrgyz RepublicLao PDRLate-demographic dividendLatin America & Caribbean Latin America & Caribbean (excluding high income)Latin America & the Caribbean (IDA & IBRD countries)LatviaLeast developed countries: UN classificationLebanonLesothoLiberiaLibyaLiechtensteinLithuaniaLow & middle incomeLow incomeLower middle incomeLuxembourgMacao SAR, ChinaMacedonia, FYRMadagascarMalawiMalaysiaMaldivesMaliMaltaMauritaniaMauritiusMexicoMiddle East & North AfricaMiddle East & North Africa (excluding high income)Middle East & North Africa (IDA & IBRD countries)Middle incomeMoldovaMonacoMongoliaMontenegroMoroccoMozambiqueMyanmarNamibiaNauruNepalNetherlandsNew ZealandNicaraguaNigerNorwayOECD membersOmanOther small statesPacific island small statesPakistanPalauPanamaPapua New GuineaParaguayPeruPhilippinesPolandPortugalPost-demographic dividendPre-demographic dividendQatarRomaniaRussian FederationRwandaSamoaSan MarinoSao Tome and PrincipeSaudi ArabiaSenegalSerbiaSeychellesSierra LeoneSingaporeSint Maarten (Dutch part)Slovak RepublicSloveniaSmall statesSolomon IslandsSomaliaSouth AfricaSouth AsiaSouth Asia (IDA & IBRD)South SudanSpainSri LankaSt. Kitts and NevisSt. LuciaSt. Vincent and the GrenadinesSub-Saharan Africa Sub-Saharan Africa (excluding high income)Sub-Saharan Africa (IDA & IBRD countries)SudanSurinameSwazilandSwedenSwitzerlandSyrian Arab RepublicTajikistanTanzaniaThailandTimor-LesteTogoTongaTrinidad and TobagoTunisiaTurkeyTurks and Caicos IslandsTuvaluUgandaUkraineUnited Arab EmiratesUnited KingdomUpper middle incomeUruguayUzbekistanVanuatuVenezuela, RBVietnamWest Bank and GazaWorldYemen, Rep.ZambiaZimbabwe Linha do tempo:
Nesta escala de tempo está apresentado um gráfico de 1972 ano até 2015 ano El Salvador. Dados de 1971 ano ausente. O número de observações reais por data: 33.
Fonte (nome):
Indicadores de desenvolvimento mundial
Fonte (organização):
UNESCO Institute for Statistics
Categorias:
Education, Gender
Foi atualizado:
23 abr 2017 ano
Indicadores de alterações dos valores ao longo dos anos
Mínimo:
5.516
1 jan 1997 ano
Máximo:
17.771
1 jan 1972 ano
Na data de observação
Valor
Mudança absoluta
A alteração em relação ao valor anterior
1 jan 1972 ano
17.771
+17.771
0.0%
1 jan 1973 ano
9.68
-8.091
-45.53%
1 jan 1974 ano
7.885
-1.795
-18.54%
1 jan 1975 ano
8.646
+0.761
9.65%
1 jan 1977 ano
9.139
+0.493
5.7%
1 jan 1978 ano
9.065
-0.073
-0.8%
1 jan 1982 ano
10.879
+1.814
20.01%
1 jan 1983 ano
9.819
-1.06
-9.74%
1 jan 1984 ano
9.486
-0.333
-3.39%
1 jan 1985 ano
10.133
+0.646
6.81%
1 jan 1988 ano
9.286
-0.846
-8.35%
1 jan 1989 ano
8.65
-0.636
-6.85%
1 jan 1990 ano
9.894
+1.244
14.38%
1 jan 1992 ano
10.17
+0.276
2.79%
1 jan 1993 ano
8.66
-1.51
-14.85%
1 jan 1994 ano
9.935
+1.275
14.72%
1 jan 1996 ano
8.042
-1.893
-19.06%
1 jan 1997 ano
5.516
-2.526
-31.41%
1 jan 1999 ano
8.256
+2.74
49.68%
1 jan 2001 ano
7.343
-0.913
-11.06%
1 jan 2002 ano
7.235
-0.107
-1.46%
1 jan 2003 ano
7.783
+0.548
7.57%
1 jan 2004 ano
7.628
-0.155
-1.99%
1 jan 2006 ano
7.426
-0.202
-2.65%
1 jan 2007 ano
8.692
+1.266
17.04%
1 jan 2008 ano
7.85
-0.842
-9.68%
1 jan 2009 ano
7.117
-0.733
-9.34%
1 jan 2010 ano
6.081
-1.036
-14.55%
1 jan 2011 ano
6.76
+0.678
11.15%
1 jan 2012 ano
6.909
+0.149
2.21%
1 jan 2013 ano
7.712
+0.803
11.62%
1 jan 2014 ano
8.233
+0.522
6.76%
1 jan 2015 ano
7.356
-0.877
-10.65%
Classificação de países por estatísticas atuais por anos


Comentários: