29
/pt/
pt
AIzaSyAYiBZKx7MnpbEhh9jyipgxe19OcubqV5w
April 1, 2024
43032
Latin America & Caribbean (excluding high income)
LAC
false
2
1
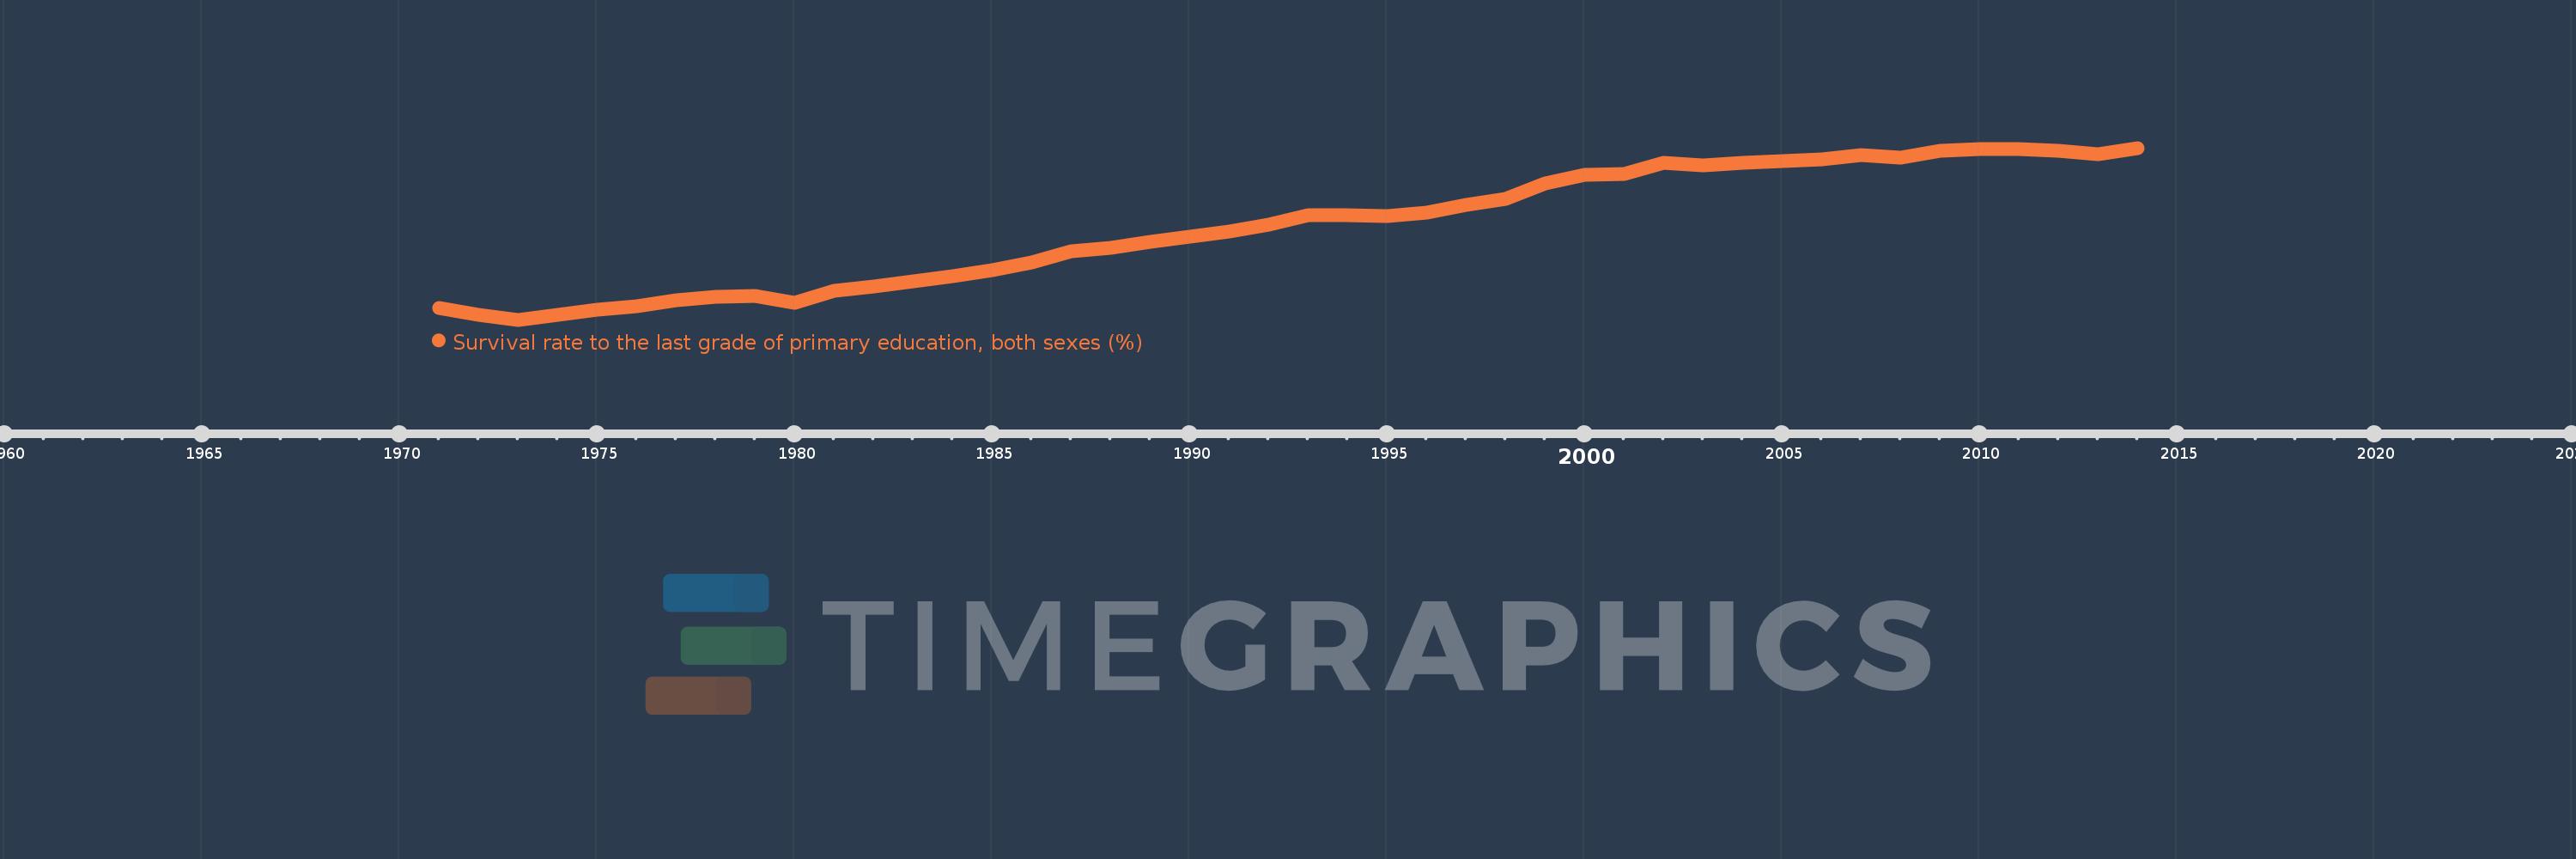
Survival rate to the last grade of primary education, both sexes (%)
2014,2013,2012,2011,2010,2009,2008,2007,2006,2005,2004,2003,2002,2001,2000,1999,1998,1997,1996,1995,1994,1993,1992,1991,1990,1989,1988,1987,1986,1985,1984,1983,1982,1981,1980,1979,1978,1977,1976,1975,1974,1973,1972,1971
Estas estatísticas em outros países:
AfghanistanAlbaniaAlgeriaAndorraAngolaAntigua and BarbudaArab WorldArgentinaArmeniaArubaAustriaAzerbaijanBahamas, TheBahrainBangladeshBarbadosBelarusBelgiumBelizeBeninBermudaBhutanBoliviaBosnia and HerzegovinaBotswanaBrazilBrunei DarussalamBulgariaBurkina FasoBurundiCabo VerdeCambodiaCameroonCanadaCaribbean small statesCayman IslandsCentral African RepublicCentral Europe and the BalticsChadChileChinaColombiaComorosCongo, Dem. Rep.Congo, Rep.Costa RicaCote d'IvoireCroatiaCubaCyprusCzech RepublicDenmarkDjiboutiDominicaDominican RepublicEarly-demographic dividendEast Asia & PacificEast Asia & Pacific (excluding high income)East Asia & Pacific (IDA & IBRD countries)EcuadorEgypt, Arab Rep.El SalvadorEquatorial GuineaEritreaEstoniaEthiopiaEuro areaEurope & Central AsiaEurope & Central Asia (excluding high income)Europe & Central Asia (IDA & IBRD countries)European UnionFijiFinlandFragile and conflict affected situationsFranceGabonGambia, TheGeorgiaGermanyGhanaGreeceGuatemalaGuineaGuinea-BissauGuyanaHaitiHeavily indebted poor countries (HIPC)High incomeHondurasHong Kong SAR, ChinaHungaryIBRD onlyIcelandIDA & IBRD totalIDA blendIDA onlyIDA totalIndiaIndonesiaIran, Islamic Rep.IraqIsraelItalyJamaicaJapanJordanKazakhstanKenyaKiribatiKorea, Rep.KuwaitKyrgyz RepublicLao PDRLate-demographic dividendLatin America & Caribbean Latin America & Caribbean (excluding high income)Latin America & the Caribbean (IDA & IBRD countries)LatviaLeast developed countries: UN classificationLebanonLesothoLiberiaLibyaLiechtensteinLithuaniaLow & middle incomeLow incomeLower middle incomeLuxembourgMacao SAR, ChinaMacedonia, FYRMadagascarMalawiMalaysiaMaldivesMaliMaltaMarshall IslandsMauritaniaMauritiusMexicoMiddle East & North AfricaMiddle East & North Africa (excluding high income)Middle East & North Africa (IDA & IBRD countries)Middle incomeMoldovaMonacoMongoliaMontenegroMoroccoMozambiqueMyanmarNamibiaNepalNetherlandsNicaraguaNigerNigeriaNorth AmericaNorwayOECD membersOmanOther small statesPacific island small statesPakistanPanamaPapua New GuineaParaguayPeruPhilippinesPolandPortugalPost-demographic dividendPre-demographic dividendQatarRomaniaRussian FederationRwandaSamoaSan MarinoSao Tome and PrincipeSaudi ArabiaSenegalSerbiaSeychellesSierra LeoneSingaporeSlovak RepublicSloveniaSmall statesSolomon IslandsSouth AfricaSouth AsiaSouth Asia (IDA & IBRD)SpainSri LankaSt. Kitts and NevisSt. LuciaSt. Vincent and the GrenadinesSub-Saharan Africa Sub-Saharan Africa (excluding high income)Sub-Saharan Africa (IDA & IBRD countries)SudanSurinameSwazilandSwedenSwitzerlandSyrian Arab RepublicTajikistanTanzaniaThailandTimor-LesteTogoTongaTrinidad and TobagoTunisiaTurkeyUgandaUkraineUnited Arab EmiratesUpper middle incomeUruguayUzbekistanVanuatuVenezuela, RBVietnamWest Bank and GazaWorldYemen, Rep.ZambiaZimbabwe Linha do tempo:
Nesta escala de tempo está apresentado um gráfico de 1971 ano até 2014 ano Latin America & Caribbean (excluding high income). Dados de 1970 ano ausente. O número de observações reais por data: 44.
Fonte (nome):
Indicadores de desenvolvimento mundial
Fonte (organização):
UNESCO Institute for Statistics
Categorias:
Education
Foi atualizado:
23 abr 2017 ano
Indicadores de alterações dos valores ao longo dos anos
Mínimo:
39.016
1 jan 1973 ano
Máximo:
83.545
1 jan 2014 ano
Na data de observação
Valor
Mudança absoluta
A alteração em relação ao valor anterior
1 jan 1971 ano
42.091
+42.091
0.0%
1 jan 1972 ano
40.329
-1.763
-4.19%
1 jan 1973 ano
39.016
-1.312
-3.25%
1 jan 1974 ano
40.243
+1.226
3.14%
1 jan 1975 ano
41.699
+1.456
3.62%
1 jan 1976 ano
42.488
+0.789
1.89%
1 jan 1977 ano
44.007
+1.519
3.57%
1 jan 1978 ano
45.026
+1.019
2.32%
1 jan 1979 ano
45.186
+0.16
0.36%
1 jan 1980 ano
43.417
-1.77
-3.92%
1 jan 1981 ano
46.58
+3.164
7.29%
1 jan 1982 ano
47.669
+1.089
2.34%
1 jan 1983 ano
48.953
+1.284
2.69%
1 jan 1984 ano
50.228
+1.275
2.6%
1 jan 1985 ano
51.842
+1.615
3.21%
1 jan 1986 ano
53.8
+1.957
3.78%
1 jan 1987 ano
56.754
+2.954
5.49%
1 jan 1988 ano
57.609
+0.855
1.51%
1 jan 1989 ano
59.281
+1.673
2.9%
1 jan 1990 ano
60.612
+1.33
2.24%
1 jan 1991 ano
61.833
+1.221
2.02%
1 jan 1992 ano
63.74
+1.907
3.08%
1 jan 1993 ano
66.135
+2.395
3.76%
1 jan 1994 ano
66.188
+0.053
0.08%
1 jan 1995 ano
65.98
-0.208
-0.31%
1 jan 1996 ano
66.682
+0.702
1.06%
1 jan 1997 ano
68.783
+2.101
3.15%
1 jan 1998 ano
70.43
+1.646
2.39%
1 jan 1999 ano
74.44
+4.01
5.69%
1 jan 2000 ano
76.674
+2.234
3.0%
1 jan 2001 ano
76.691
+0.016
0.02%
1 jan 2002 ano
79.732
+3.041
3.97%
1 jan 2003 ano
79.016
-0.715
-0.9%
1 jan 2004 ano
79.681
+0.664
0.84%
1 jan 2005 ano
80.057
+0.376
0.47%
1 jan 2006 ano
80.597
+0.541
0.68%
1 jan 2007 ano
81.744
+1.147
1.42%
1 jan 2008 ano
81.138
-0.606
-0.74%
1 jan 2009 ano
82.921
+1.783
2.2%
1 jan 2010 ano
83.192
+0.271
0.33%
1 jan 2011 ano
83.293
+0.1
0.12%
1 jan 2012 ano
82.856
-0.436
-0.52%
1 jan 2013 ano
81.989
-0.868
-1.05%
1 jan 2014 ano
83.545
+1.556
1.9%
Classificação de países por estatísticas atuais por anos


Comentários: