29
/pt/
pt
AIzaSyAYiBZKx7MnpbEhh9jyipgxe19OcubqV5w
April 1, 2024
265314
Togo
TGO
true
2
1
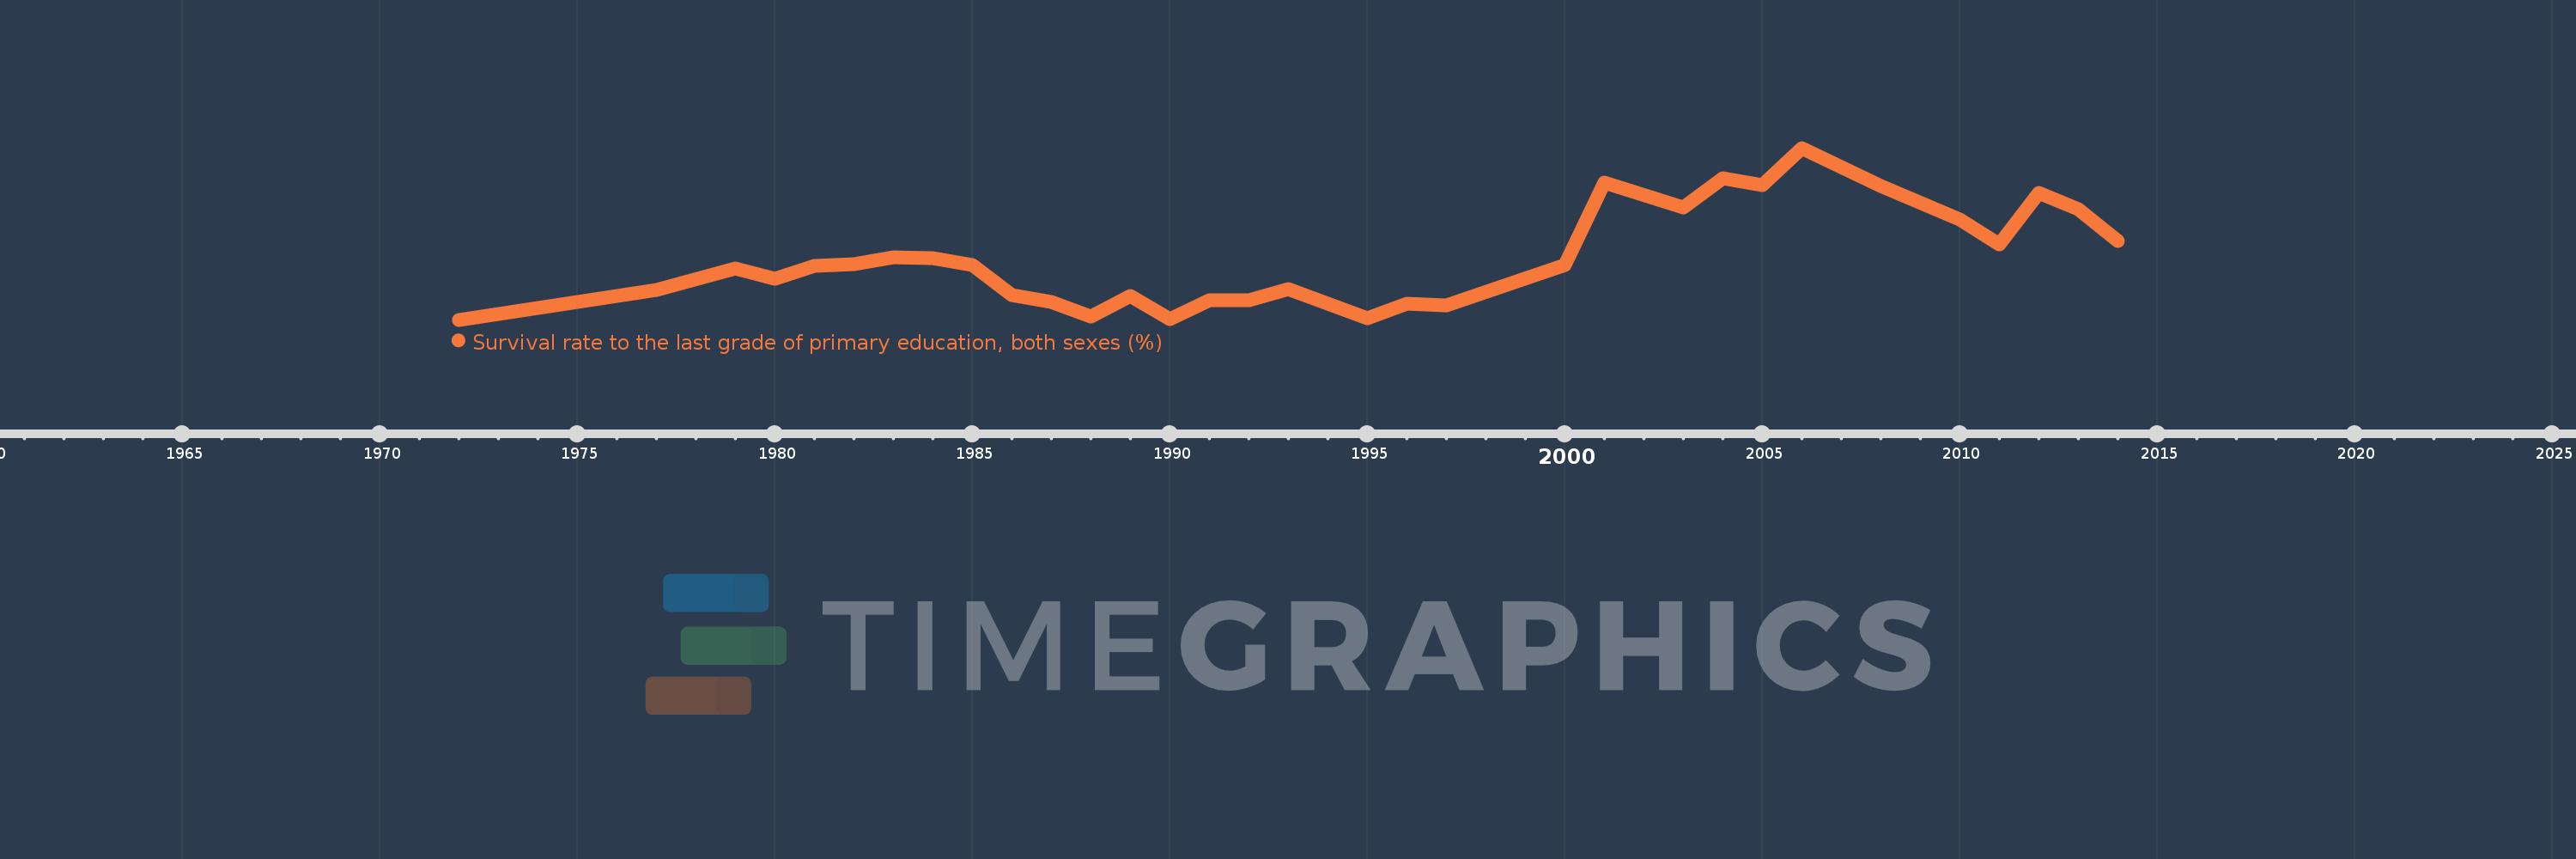
Survival rate to the last grade of primary education, both sexes (%)
2014,2013,2012,2011,2010,2008,2006,2005,2004,2003,2001,2000,1997,1996,1995,1993,1992,1991,1990,1989,1988,1987,1986,1985,1984,1983,1982,1981,1980,1979,1977,1973,1972
Estas estatísticas em outros países:
AfghanistanAlbaniaAlgeriaAndorraAngolaAntigua and BarbudaArab WorldArgentinaArmeniaArubaAustriaAzerbaijanBahamas, TheBahrainBangladeshBarbadosBelarusBelgiumBelizeBeninBermudaBhutanBoliviaBosnia and HerzegovinaBotswanaBrazilBrunei DarussalamBulgariaBurkina FasoBurundiCabo VerdeCambodiaCameroonCanadaCaribbean small statesCayman IslandsCentral African RepublicCentral Europe and the BalticsChadChileChinaColombiaComorosCongo, Dem. Rep.Congo, Rep.Costa RicaCote d'IvoireCroatiaCubaCyprusCzech RepublicDenmarkDjiboutiDominicaDominican RepublicEarly-demographic dividendEast Asia & PacificEast Asia & Pacific (excluding high income)East Asia & Pacific (IDA & IBRD countries)EcuadorEgypt, Arab Rep.El SalvadorEquatorial GuineaEritreaEstoniaEthiopiaEuro areaEurope & Central AsiaEurope & Central Asia (excluding high income)Europe & Central Asia (IDA & IBRD countries)European UnionFijiFinlandFragile and conflict affected situationsFranceGabonGambia, TheGeorgiaGermanyGhanaGreeceGuatemalaGuineaGuinea-BissauGuyanaHaitiHeavily indebted poor countries (HIPC)High incomeHondurasHong Kong SAR, ChinaHungaryIBRD onlyIcelandIDA & IBRD totalIDA blendIDA onlyIDA totalIndiaIndonesiaIran, Islamic Rep.IraqIsraelItalyJamaicaJapanJordanKazakhstanKenyaKiribatiKorea, Rep.KuwaitKyrgyz RepublicLao PDRLate-demographic dividendLatin America & Caribbean Latin America & Caribbean (excluding high income)Latin America & the Caribbean (IDA & IBRD countries)LatviaLeast developed countries: UN classificationLebanonLesothoLiberiaLibyaLiechtensteinLithuaniaLow & middle incomeLow incomeLower middle incomeLuxembourgMacao SAR, ChinaMacedonia, FYRMadagascarMalawiMalaysiaMaldivesMaliMaltaMarshall IslandsMauritaniaMauritiusMexicoMiddle East & North AfricaMiddle East & North Africa (excluding high income)Middle East & North Africa (IDA & IBRD countries)Middle incomeMoldovaMonacoMongoliaMontenegroMoroccoMozambiqueMyanmarNamibiaNepalNetherlandsNicaraguaNigerNigeriaNorth AmericaNorwayOECD membersOmanOther small statesPacific island small statesPakistanPanamaPapua New GuineaParaguayPeruPhilippinesPolandPortugalPost-demographic dividendPre-demographic dividendQatarRomaniaRussian FederationRwandaSamoaSan MarinoSao Tome and PrincipeSaudi ArabiaSenegalSerbiaSeychellesSierra LeoneSingaporeSlovak RepublicSloveniaSmall statesSolomon IslandsSouth AfricaSouth AsiaSouth Asia (IDA & IBRD)SpainSri LankaSt. Kitts and NevisSt. LuciaSt. Vincent and the GrenadinesSub-Saharan Africa Sub-Saharan Africa (excluding high income)Sub-Saharan Africa (IDA & IBRD countries)SudanSurinameSwazilandSwedenSwitzerlandSyrian Arab RepublicTajikistanTanzaniaThailandTimor-LesteTogoTongaTrinidad and TobagoTunisiaTurkeyUgandaUkraineUnited Arab EmiratesUpper middle incomeUruguayUzbekistanVanuatuVenezuela, RBVietnamWest Bank and GazaWorldYemen, Rep.ZambiaZimbabwe Linha do tempo:
Nesta escala de tempo está apresentado um gráfico de 1972 ano até 2014 ano Togo. Dados de 1971 ano ausente. O número de observações reais por data: 33.
Fonte (nome):
Indicadores de desenvolvimento mundial
Fonte (organização):
UNESCO Institute for Statistics
Categorias:
Education
Foi atualizado:
23 abr 2017 ano
Indicadores de alterações dos valores ao longo dos anos
Mínimo:
29.383
1 jan 1972 ano
Máximo:
80.583
1 jan 2006 ano
Na data de observação
Valor
Mudança absoluta
A alteração em relação ao valor anterior
1 jan 1972 ano
29.383
+29.383
0.0%
1 jan 1973 ano
31.165
+1.782
6.07%
1 jan 1977 ano
38.168
+7.004
22.47%
1 jan 1979 ano
44.773
+6.605
17.3%
1 jan 1980 ano
41.611
-3.162
-7.06%
1 jan 1981 ano
45.529
+3.918
9.42%
1 jan 1982 ano
45.954
+0.425
0.93%
1 jan 1983 ano
48.049
+2.095
4.56%
1 jan 1984 ano
47.627
-0.423
-0.88%
1 jan 1985 ano
45.63
-1.997
-4.19%
1 jan 1986 ano
36.702
-8.928
-19.57%
1 jan 1987 ano
34.639
-2.062
-5.62%
1 jan 1988 ano
30.368
-4.271
-12.33%
1 jan 1989 ano
36.384
+6.016
19.81%
1 jan 1990 ano
29.685
-6.698
-18.41%
1 jan 1991 ano
35.254
+5.568
18.76%
1 jan 1992 ano
35.206
-0.048
-0.14%
1 jan 1993 ano
38.481
+3.275
9.3%
1 jan 1995 ano
29.835
-8.646
-22.47%
1 jan 1996 ano
34.049
+4.214
14.13%
1 jan 1997 ano
33.649
-0.4
-1.17%
1 jan 2000 ano
45.66
+12.011
35.7%
1 jan 2001 ano
70.24
+24.58
53.83%
1 jan 2003 ano
62.752
-7.488
-10.66%
1 jan 2004 ano
71.625
+8.872
14.14%
1 jan 2005 ano
69.444
-2.181
-3.04%
1 jan 2006 ano
80.583
+11.139
16.04%
1 jan 2008 ano
69.341
-11.242
-13.95%
1 jan 2010 ano
59.352
-9.99
-14.41%
1 jan 2011 ano
51.727
-7.625
-12.85%
1 jan 2012 ano
67.089
+15.362
29.7%
1 jan 2013 ano
62.386
-4.703
-7.01%
1 jan 2014 ano
52.834
-9.552
-15.31%
Classificação de países por estatísticas atuais por anos


Comentários: