29
/pt/
pt
AIzaSyAYiBZKx7MnpbEhh9jyipgxe19OcubqV5w
April 1, 2024
31160
Europe & Central Asia
ECS
false
2
1
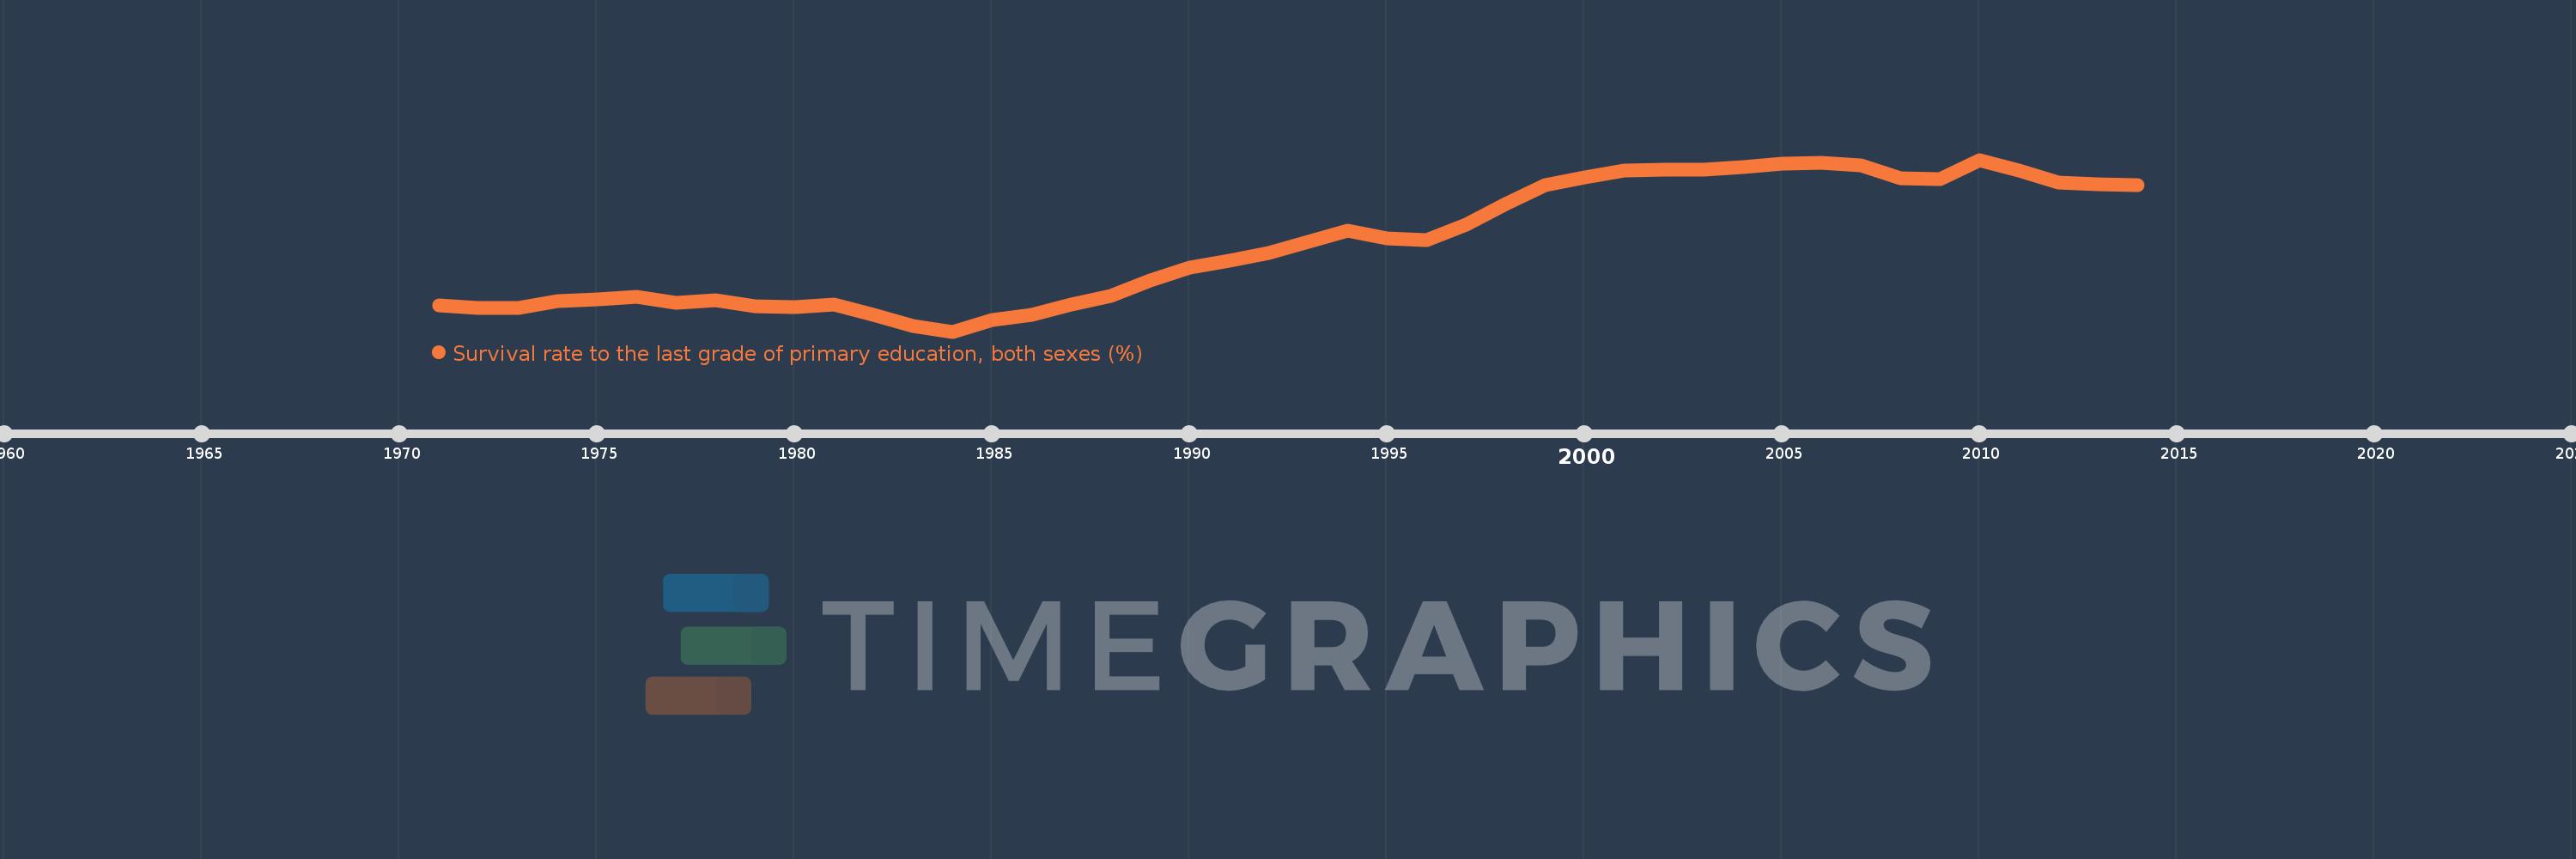
Survival rate to the last grade of primary education, both sexes (%)
2014,2013,2012,2011,2010,2009,2008,2007,2006,2005,2004,2003,2002,2001,2000,1999,1998,1997,1996,1995,1994,1993,1992,1991,1990,1989,1988,1987,1986,1985,1984,1983,1982,1981,1980,1979,1978,1977,1976,1975,1974,1973,1972,1971
Estas estatísticas em outros países:
AfghanistanAlbaniaAlgeriaAndorraAngolaAntigua and BarbudaArab WorldArgentinaArmeniaArubaAustriaAzerbaijanBahamas, TheBahrainBangladeshBarbadosBelarusBelgiumBelizeBeninBermudaBhutanBoliviaBosnia and HerzegovinaBotswanaBrazilBrunei DarussalamBulgariaBurkina FasoBurundiCabo VerdeCambodiaCameroonCanadaCaribbean small statesCayman IslandsCentral African RepublicCentral Europe and the BalticsChadChileChinaColombiaComorosCongo, Dem. Rep.Congo, Rep.Costa RicaCote d'IvoireCroatiaCubaCyprusCzech RepublicDenmarkDjiboutiDominicaDominican RepublicEarly-demographic dividendEast Asia & PacificEast Asia & Pacific (excluding high income)East Asia & Pacific (IDA & IBRD countries)EcuadorEgypt, Arab Rep.El SalvadorEquatorial GuineaEritreaEstoniaEthiopiaEuro areaEurope & Central AsiaEurope & Central Asia (excluding high income)Europe & Central Asia (IDA & IBRD countries)European UnionFijiFinlandFragile and conflict affected situationsFranceGabonGambia, TheGeorgiaGermanyGhanaGreeceGuatemalaGuineaGuinea-BissauGuyanaHaitiHeavily indebted poor countries (HIPC)High incomeHondurasHong Kong SAR, ChinaHungaryIBRD onlyIcelandIDA & IBRD totalIDA blendIDA onlyIDA totalIndiaIndonesiaIran, Islamic Rep.IraqIsraelItalyJamaicaJapanJordanKazakhstanKenyaKiribatiKorea, Rep.KuwaitKyrgyz RepublicLao PDRLate-demographic dividendLatin America & Caribbean Latin America & Caribbean (excluding high income)Latin America & the Caribbean (IDA & IBRD countries)LatviaLeast developed countries: UN classificationLebanonLesothoLiberiaLibyaLiechtensteinLithuaniaLow & middle incomeLow incomeLower middle incomeLuxembourgMacao SAR, ChinaMacedonia, FYRMadagascarMalawiMalaysiaMaldivesMaliMaltaMarshall IslandsMauritaniaMauritiusMexicoMiddle East & North AfricaMiddle East & North Africa (excluding high income)Middle East & North Africa (IDA & IBRD countries)Middle incomeMoldovaMonacoMongoliaMontenegroMoroccoMozambiqueMyanmarNamibiaNepalNetherlandsNicaraguaNigerNigeriaNorth AmericaNorwayOECD membersOmanOther small statesPacific island small statesPakistanPanamaPapua New GuineaParaguayPeruPhilippinesPolandPortugalPost-demographic dividendPre-demographic dividendQatarRomaniaRussian FederationRwandaSamoaSan MarinoSao Tome and PrincipeSaudi ArabiaSenegalSerbiaSeychellesSierra LeoneSingaporeSlovak RepublicSloveniaSmall statesSolomon IslandsSouth AfricaSouth AsiaSouth Asia (IDA & IBRD)SpainSri LankaSt. Kitts and NevisSt. LuciaSt. Vincent and the GrenadinesSub-Saharan Africa Sub-Saharan Africa (excluding high income)Sub-Saharan Africa (IDA & IBRD countries)SudanSurinameSwazilandSwedenSwitzerlandSyrian Arab RepublicTajikistanTanzaniaThailandTimor-LesteTogoTongaTrinidad and TobagoTunisiaTurkeyUgandaUkraineUnited Arab EmiratesUpper middle incomeUruguayUzbekistanVanuatuVenezuela, RBVietnamWest Bank and GazaWorldYemen, Rep.ZambiaZimbabwe Linha do tempo:
Nesta escala de tempo está apresentado um gráfico de 1971 ano até 2014 ano Europe & Central Asia. Dados de 1970 ano ausente. O número de observações reais por data: 44.
Fonte (nome):
Indicadores de desenvolvimento mundial
Fonte (organização):
UNESCO Institute for Statistics
Categorias:
Education
Foi atualizado:
23 abr 2017 ano
Indicadores de alterações dos valores ao longo dos anos
Mínimo:
87.278
1 jan 1984 ano
Máximo:
96.714
1 jan 2010 ano
Na data de observação
Valor
Mudança absoluta
A alteração em relação ao valor anterior
1 jan 1971 ano
88.727
+88.727
0.0%
1 jan 1972 ano
88.586
-0.141
-0.16%
1 jan 1973 ano
88.555
-0.031
-0.04%
1 jan 1974 ano
88.936
+0.381
0.43%
1 jan 1975 ano
89.036
+0.101
0.11%
1 jan 1976 ano
89.188
+0.152
0.17%
1 jan 1977 ano
88.857
-0.332
-0.37%
1 jan 1978 ano
89.007
+0.15
0.17%
1 jan 1979 ano
88.69
-0.317
-0.36%
1 jan 1980 ano
88.608
-0.082
-0.09%
1 jan 1981 ano
88.781
+0.173
0.2%
1 jan 1982 ano
88.214
-0.567
-0.64%
1 jan 1983 ano
87.566
-0.648
-0.73%
1 jan 1984 ano
87.278
-0.288
-0.33%
1 jan 1985 ano
87.907
+0.629
0.72%
1 jan 1986 ano
88.219
+0.312
0.35%
1 jan 1987 ano
88.763
+0.545
0.62%
1 jan 1988 ano
89.25
+0.487
0.55%
1 jan 1989 ano
90.081
+0.831
0.93%
1 jan 1990 ano
90.811
+0.729
0.81%
1 jan 1991 ano
91.151
+0.34
0.37%
1 jan 1992 ano
91.599
+0.449
0.49%
1 jan 1993 ano
92.211
+0.612
0.67%
1 jan 1994 ano
92.812
+0.6
0.65%
1 jan 1995 ano
92.379
-0.433
-0.47%
1 jan 1996 ano
92.315
-0.064
-0.07%
1 jan 1997 ano
93.156
+0.841
0.91%
1 jan 1998 ano
94.298
+1.142
1.23%
1 jan 1999 ano
95.342
+1.044
1.11%
1 jan 2000 ano
95.744
+0.402
0.42%
1 jan 2001 ano
96.109
+0.365
0.38%
1 jan 2002 ano
96.159
+0.05
0.05%
1 jan 2003 ano
96.176
+0.017
0.02%
1 jan 2004 ano
96.303
+0.127
0.13%
1 jan 2005 ano
96.507
+0.204
0.21%
1 jan 2006 ano
96.561
+0.054
0.06%
1 jan 2007 ano
96.399
-0.162
-0.17%
1 jan 2008 ano
95.721
-0.678
-0.7%
1 jan 2009 ano
95.629
-0.092
-0.1%
1 jan 2010 ano
96.714
+1.085
1.13%
1 jan 2011 ano
96.115
-0.599
-0.62%
1 jan 2012 ano
95.453
-0.662
-0.69%
1 jan 2013 ano
95.368
-0.084
-0.09%
1 jan 2014 ano
95.337
-0.032
-0.03%
Classificação de países por estatísticas atuais por anos


Comentários: