29
/pt/
pt
AIzaSyAYiBZKx7MnpbEhh9jyipgxe19OcubqV5w
April 1, 2024
42420
Latin America & Caribbean (excluding high income)
LAC
false
2
1
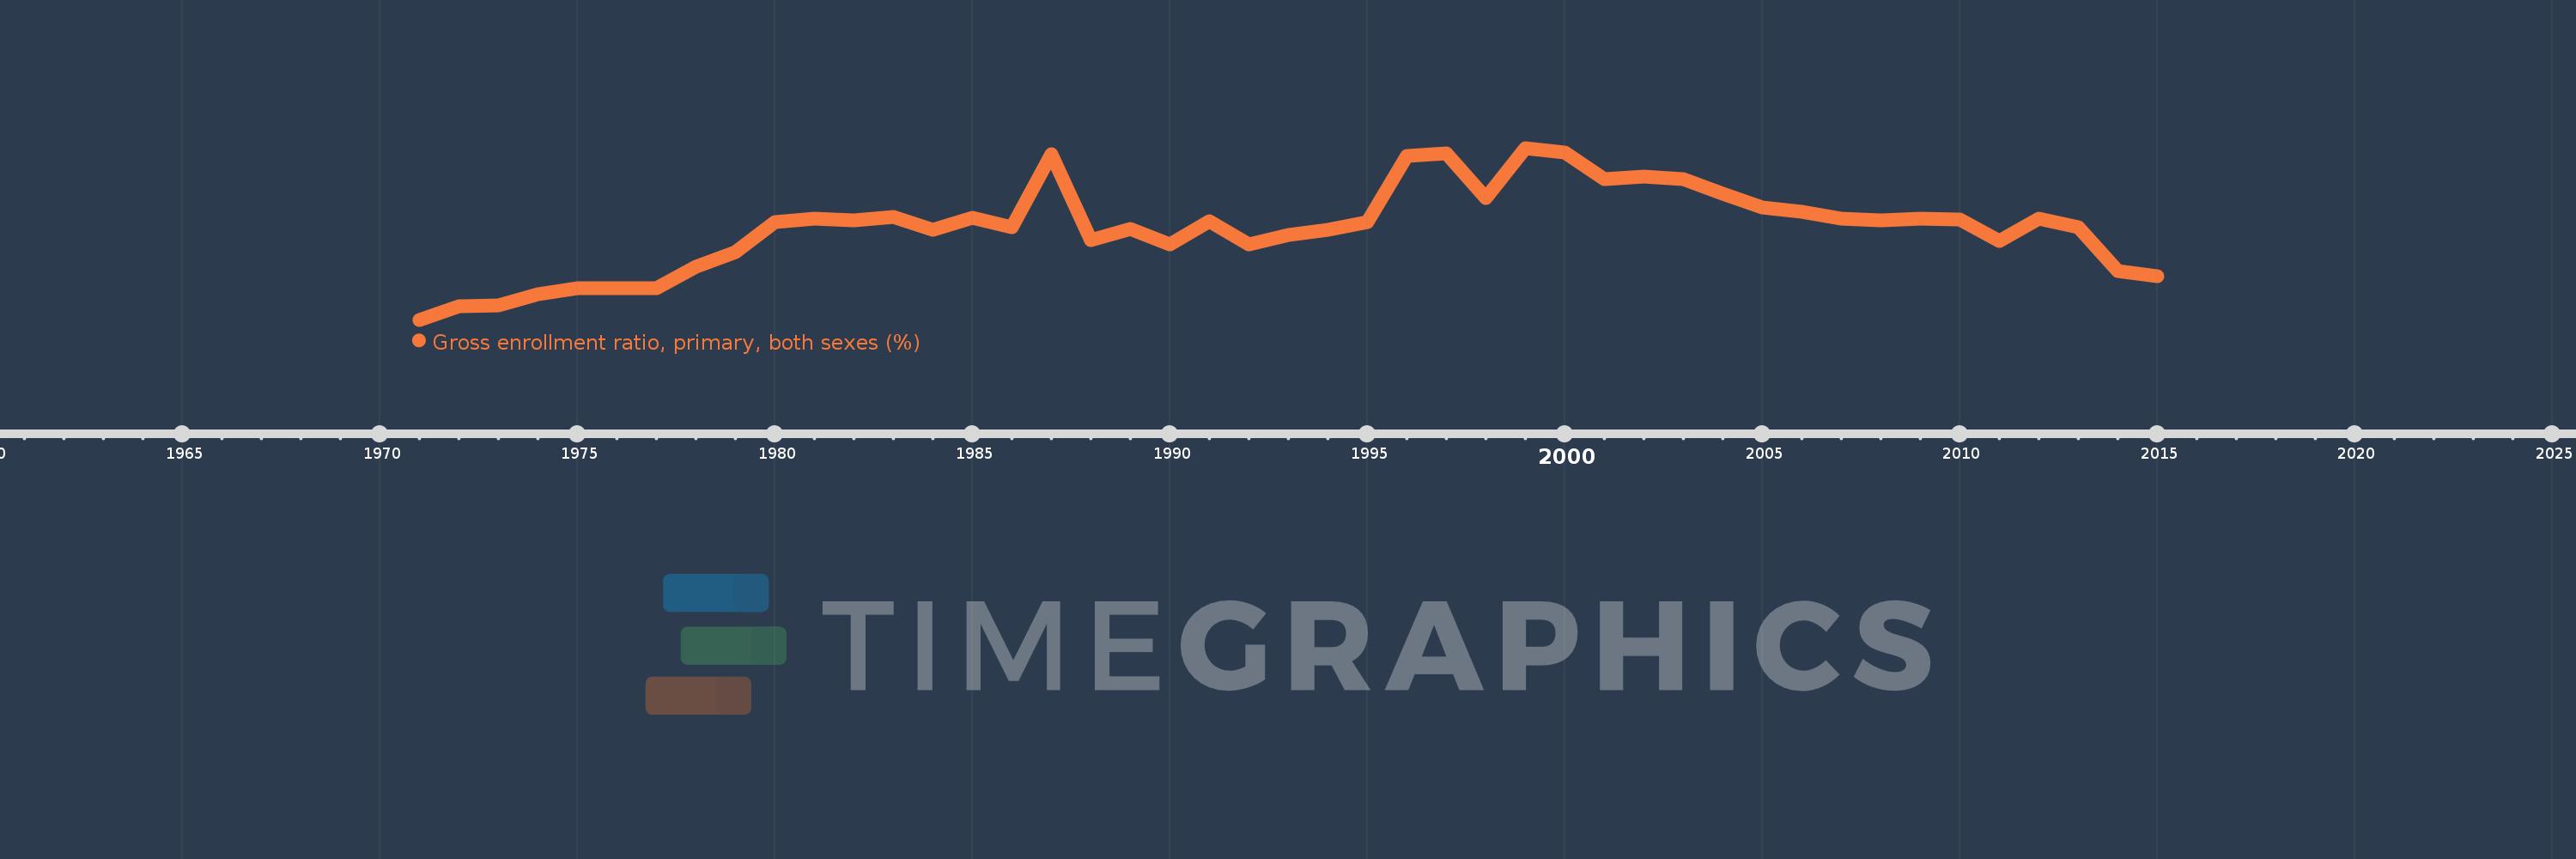
Gross enrollment ratio, primary, both sexes (%)
2015,2014,2013,2012,2011,2010,2009,2008,2007,2006,2005,2004,2003,2002,2001,2000,1999,1998,1997,1996,1995,1994,1993,1992,1991,1990,1989,1988,1987,1986,1985,1984,1983,1982,1981,1980,1979,1978,1977,1976,1975,1974,1973,1972,1971
Estas estatísticas em outros países:
AfghanistanAlbaniaAlgeriaAndorraAngolaAntigua and BarbudaArab WorldArgentinaArmeniaArubaAustraliaAustriaAzerbaijanBahamas, TheBahrainBangladeshBarbadosBelarusBelgiumBelizeBeninBermudaBhutanBoliviaBosnia and HerzegovinaBotswanaBrazilBritish Virgin IslandsBrunei DarussalamBulgariaBurkina FasoBurundiCabo VerdeCambodiaCameroonCanadaCaribbean small statesCentral African RepublicCentral Europe and the BalticsChadChileChinaColombiaComorosCongo, Dem. Rep.Congo, Rep.Costa RicaCote d'IvoireCroatiaCubaCuracaoCyprusCzech RepublicDenmarkDjiboutiDominicaDominican RepublicEarly-demographic dividendEast Asia & PacificEast Asia & Pacific (excluding high income)East Asia & Pacific (IDA & IBRD countries)EcuadorEgypt, Arab Rep.El SalvadorEquatorial GuineaEritreaEstoniaEthiopiaEuro areaEurope & Central AsiaEurope & Central Asia (excluding high income)Europe & Central Asia (IDA & IBRD countries)European UnionFijiFinlandFragile and conflict affected situationsFranceGabonGambia, TheGeorgiaGermanyGhanaGreeceGrenadaGuatemalaGuineaGuinea-BissauGuyanaHaitiHeavily indebted poor countries (HIPC)High incomeHondurasHong Kong SAR, ChinaHungaryIBRD onlyIcelandIDA & IBRD totalIDA blendIDA onlyIDA totalIndiaIndonesiaIran, Islamic Rep.IraqIrelandIsraelItalyJamaicaJapanJordanKazakhstanKenyaKiribatiKorea, Dem. People’s Rep.Korea, Rep.KuwaitKyrgyz RepublicLao PDRLate-demographic dividendLatin America & Caribbean Latin America & Caribbean (excluding high income)Latin America & the Caribbean (IDA & IBRD countries)LatviaLeast developed countries: UN classificationLebanonLesothoLiberiaLibyaLiechtensteinLithuaniaLow & middle incomeLow incomeLower middle incomeLuxembourgMacao SAR, ChinaMacedonia, FYRMadagascarMalawiMalaysiaMaldivesMaliMaltaMarshall IslandsMauritaniaMauritiusMexicoMicronesia, Fed. Sts.Middle East & North AfricaMiddle East & North Africa (excluding high income)Middle East & North Africa (IDA & IBRD countries)Middle incomeMoldovaMongoliaMontenegroMoroccoMozambiqueMyanmarNamibiaNauruNepalNetherlandsNew ZealandNicaraguaNigerNigeriaNorth AmericaNorwayOECD membersOmanOther small statesPacific island small statesPakistanPalauPanamaPapua New GuineaParaguayPeruPhilippinesPolandPortugalPost-demographic dividendPre-demographic dividendPuerto RicoQatarRomaniaRussian FederationRwandaSamoaSan MarinoSao Tome and PrincipeSaudi ArabiaSenegalSerbiaSeychellesSierra LeoneSlovak RepublicSloveniaSmall statesSolomon IslandsSomaliaSouth AfricaSouth AsiaSouth Asia (IDA & IBRD)South SudanSpainSri LankaSt. Kitts and NevisSt. LuciaSt. Vincent and the GrenadinesSub-Saharan Africa Sub-Saharan Africa (excluding high income)Sub-Saharan Africa (IDA & IBRD countries)SudanSurinameSwazilandSwedenSwitzerlandSyrian Arab RepublicTajikistanTanzaniaThailandTimor-LesteTogoTongaTrinidad and TobagoTunisiaTurkeyTurkmenistanTuvaluUgandaUkraineUnited Arab EmiratesUnited KingdomUnited StatesUpper middle incomeUruguayUzbekistanVanuatuVenezuela, RBVietnamWest Bank and GazaWorldYemen, Rep.ZambiaZimbabwe Linha do tempo:
Nesta escala de tempo está apresentado um gráfico de 1971 ano até 2015 ano Latin America & Caribbean (excluding high income). Dados de 1970 ano ausente. O número de observações reais por data: 45.
Fonte (nome):
Indicadores de desenvolvimento mundial
Fonte (organização):
UNESCO Institute for Statistics
Categorias:
Education
Foi atualizado:
23 abr 2017 ano
Indicadores de alterações dos valores ao longo dos anos
Mínimo:
103.671
1 jan 1971 ano
Máximo:
123.41
1 jan 1999 ano
Na data de observação
Valor
Mudança absoluta
A alteração em relação ao valor anterior
1 jan 1971 ano
103.671
+103.671
0.0%
1 jan 1972 ano
105.24
+1.569
1.51%
1 jan 1973 ano
105.313
+0.073
0.07%
1 jan 1974 ano
106.594
+1.28
1.22%
1 jan 1975 ano
107.309
+0.715
0.67%
1 jan 1976 ano
107.337
+0.028
0.03%
1 jan 1977 ano
107.259
-0.078
-0.07%
1 jan 1978 ano
109.752
+2.493
2.32%
1 jan 1979 ano
111.435
+1.683
1.53%
1 jan 1980 ano
114.881
+3.447
3.09%
1 jan 1981 ano
115.259
+0.378
0.33%
1 jan 1982 ano
115.042
-0.217
-0.19%
1 jan 1983 ano
115.522
+0.481
0.42%
1 jan 1984 ano
114.028
-1.495
-1.29%
1 jan 1985 ano
115.423
+1.396
1.22%
1 jan 1986 ano
114.336
-1.088
-0.94%
1 jan 1987 ano
122.709
+8.374
7.32%
1 jan 1988 ano
112.828
-9.881
-8.05%
1 jan 1989 ano
114.142
+1.313
1.16%
1 jan 1990 ano
112.307
-1.835
-1.61%
1 jan 1991 ano
115.009
+2.702
2.41%
1 jan 1992 ano
112.332
-2.677
-2.33%
1 jan 1993 ano
113.382
+1.05
0.93%
1 jan 1994 ano
113.997
+0.615
0.54%
1 jan 1995 ano
114.887
+0.89
0.78%
1 jan 1996 ano
122.443
+7.557
6.58%
1 jan 1997 ano
122.779
+0.335
0.27%
1 jan 1998 ano
117.697
-5.081
-4.14%
1 jan 1999 ano
123.41
+5.712
4.85%
1 jan 2000 ano
122.878
-0.532
-0.43%
1 jan 2001 ano
119.808
-3.07
-2.5%
1 jan 2002 ano
120.118
+0.309
0.26%
1 jan 2003 ano
119.833
-0.284
-0.24%
1 jan 2004 ano
118.105
-1.729
-1.44%
1 jan 2005 ano
116.527
-1.577
-1.34%
1 jan 2006 ano
116.101
-0.427
-0.37%
1 jan 2007 ano
115.328
-0.772
-0.66%
1 jan 2008 ano
115.041
-0.288
-0.25%
1 jan 2009 ano
115.327
+0.286
0.25%
1 jan 2010 ano
115.236
-0.091
-0.08%
1 jan 2011 ano
112.743
-2.493
-2.16%
1 jan 2012 ano
115.28
+2.536
2.25%
1 jan 2013 ano
114.287
-0.992
-0.86%
1 jan 2014 ano
109.255
-5.032
-4.4%
1 jan 2015 ano
108.639
-0.617
-0.56%
Classificação de países por estatísticas atuais por anos


Comentários: