29
/pt/
pt
AIzaSyAYiBZKx7MnpbEhh9jyipgxe19OcubqV5w
April 1, 2024
227466
Qatar
QAT
true
2
1
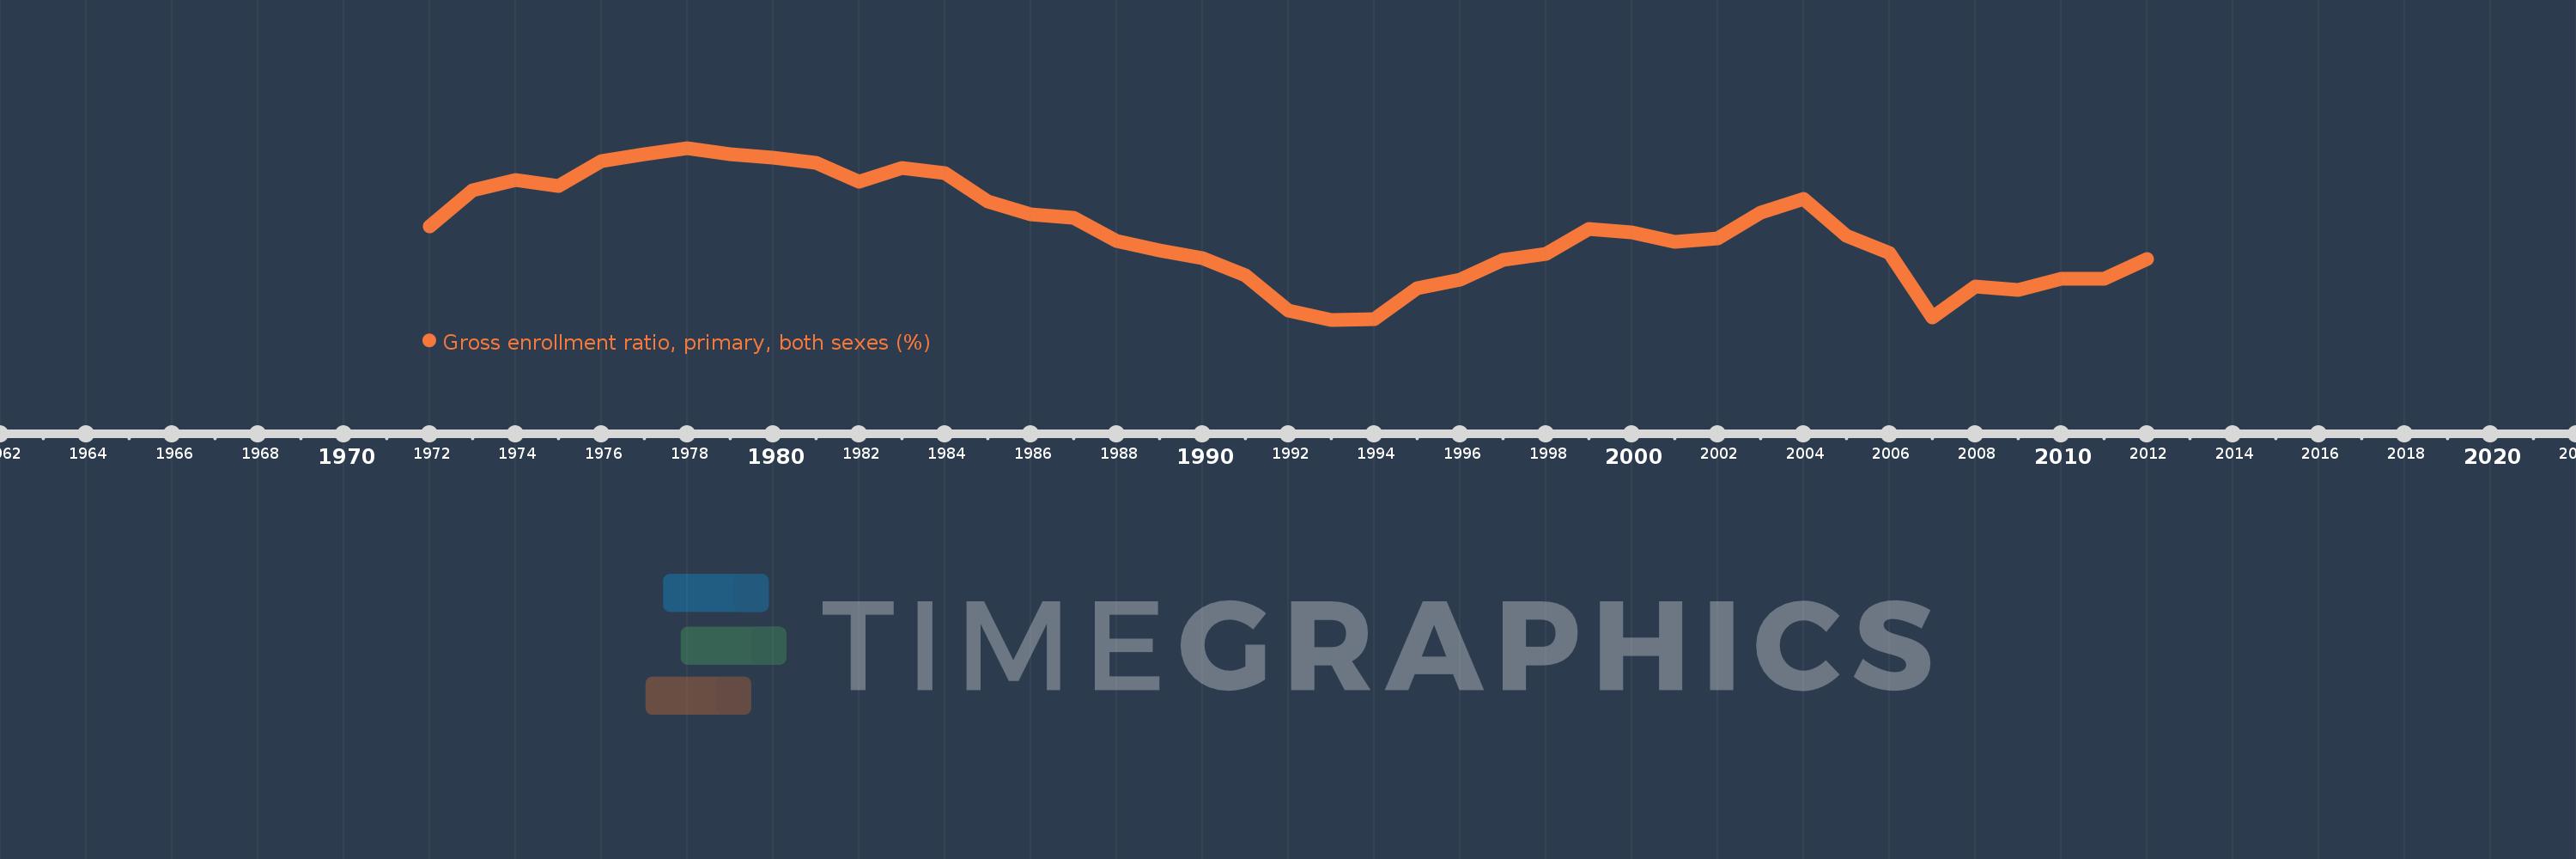
Gross enrollment ratio, primary, both sexes (%)
2012,2011,2010,2009,2008,2007,2006,2005,2004,2003,2002,2001,2000,1999,1998,1997,1996,1995,1994,1993,1992,1991,1990,1989,1988,1987,1986,1985,1984,1983,1982,1981,1980,1979,1978,1977,1976,1975,1974,1973,1972
Estas estatísticas em outros países:
AfghanistanAlbaniaAlgeriaAndorraAngolaAntigua and BarbudaArab WorldArgentinaArmeniaArubaAustraliaAustriaAzerbaijanBahamas, TheBahrainBangladeshBarbadosBelarusBelgiumBelizeBeninBermudaBhutanBoliviaBosnia and HerzegovinaBotswanaBrazilBritish Virgin IslandsBrunei DarussalamBulgariaBurkina FasoBurundiCabo VerdeCambodiaCameroonCanadaCaribbean small statesCentral African RepublicCentral Europe and the BalticsChadChileChinaColombiaComorosCongo, Dem. Rep.Congo, Rep.Costa RicaCote d'IvoireCroatiaCubaCuracaoCyprusCzech RepublicDenmarkDjiboutiDominicaDominican RepublicEarly-demographic dividendEast Asia & PacificEast Asia & Pacific (excluding high income)East Asia & Pacific (IDA & IBRD countries)EcuadorEgypt, Arab Rep.El SalvadorEquatorial GuineaEritreaEstoniaEthiopiaEuro areaEurope & Central AsiaEurope & Central Asia (excluding high income)Europe & Central Asia (IDA & IBRD countries)European UnionFijiFinlandFragile and conflict affected situationsFranceGabonGambia, TheGeorgiaGermanyGhanaGreeceGrenadaGuatemalaGuineaGuinea-BissauGuyanaHaitiHeavily indebted poor countries (HIPC)High incomeHondurasHong Kong SAR, ChinaHungaryIBRD onlyIcelandIDA & IBRD totalIDA blendIDA onlyIDA totalIndiaIndonesiaIran, Islamic Rep.IraqIrelandIsraelItalyJamaicaJapanJordanKazakhstanKenyaKiribatiKorea, Dem. People’s Rep.Korea, Rep.KuwaitKyrgyz RepublicLao PDRLate-demographic dividendLatin America & Caribbean Latin America & Caribbean (excluding high income)Latin America & the Caribbean (IDA & IBRD countries)LatviaLeast developed countries: UN classificationLebanonLesothoLiberiaLibyaLiechtensteinLithuaniaLow & middle incomeLow incomeLower middle incomeLuxembourgMacao SAR, ChinaMacedonia, FYRMadagascarMalawiMalaysiaMaldivesMaliMaltaMarshall IslandsMauritaniaMauritiusMexicoMicronesia, Fed. Sts.Middle East & North AfricaMiddle East & North Africa (excluding high income)Middle East & North Africa (IDA & IBRD countries)Middle incomeMoldovaMongoliaMontenegroMoroccoMozambiqueMyanmarNamibiaNauruNepalNetherlandsNew ZealandNicaraguaNigerNigeriaNorth AmericaNorwayOECD membersOmanOther small statesPacific island small statesPakistanPalauPanamaPapua New GuineaParaguayPeruPhilippinesPolandPortugalPost-demographic dividendPre-demographic dividendPuerto RicoQatarRomaniaRussian FederationRwandaSamoaSan MarinoSao Tome and PrincipeSaudi ArabiaSenegalSerbiaSeychellesSierra LeoneSlovak RepublicSloveniaSmall statesSolomon IslandsSomaliaSouth AfricaSouth AsiaSouth Asia (IDA & IBRD)South SudanSpainSri LankaSt. Kitts and NevisSt. LuciaSt. Vincent and the GrenadinesSub-Saharan Africa Sub-Saharan Africa (excluding high income)Sub-Saharan Africa (IDA & IBRD countries)SudanSurinameSwazilandSwedenSwitzerlandSyrian Arab RepublicTajikistanTanzaniaThailandTimor-LesteTogoTongaTrinidad and TobagoTunisiaTurkeyTurkmenistanTuvaluUgandaUkraineUnited Arab EmiratesUnited KingdomUnited StatesUpper middle incomeUruguayUzbekistanVanuatuVenezuela, RBVietnamWest Bank and GazaWorldYemen, Rep.ZambiaZimbabwe Linha do tempo:
Nesta escala de tempo está apresentado um gráfico de 1972 ano até 2012 ano Qatar. Dados de 1971 ano ausente. O número de observações reais por data: 41.
Fonte (nome):
Indicadores de desenvolvimento mundial
Fonte (organização):
UNESCO Institute for Statistics
Categorias:
Education
Foi atualizado:
23 abr 2017 ano
Indicadores de alterações dos valores ao longo dos anos
Mínimo:
89.183
1 jan 1993 ano
Máximo:
123.677
1 jan 1978 ano
Na data de observação
Valor
Mudança absoluta
A alteração em relação ao valor anterior
1 jan 1972 ano
107.993
+107.993
0.0%
1 jan 1973 ano
115.196
+7.204
6.67%
1 jan 1974 ano
117.171
+1.974
1.71%
1 jan 1975 ano
116.058
-1.113
-0.95%
1 jan 1976 ano
121.105
+5.047
4.35%
1 jan 1977 ano
122.421
+1.316
1.09%
1 jan 1978 ano
123.677
+1.256
1.03%
1 jan 1979 ano
122.423
-1.255
-1.01%
1 jan 1980 ano
121.701
-0.722
-0.59%
1 jan 1981 ano
120.659
-1.042
-0.86%
1 jan 1982 ano
116.853
-3.806
-3.15%
1 jan 1983 ano
119.62
+2.767
2.37%
1 jan 1984 ano
118.558
-1.062
-0.89%
1 jan 1985 ano
112.878
-5.68
-4.79%
1 jan 1986 ano
110.27
-2.608
-2.31%
1 jan 1987 ano
109.738
-0.532
-0.48%
1 jan 1988 ano
104.917
-4.821
-4.39%
1 jan 1989 ano
103.163
-1.754
-1.67%
1 jan 1990 ano
101.522
-1.641
-1.59%
1 jan 1991 ano
98.119
-3.403
-3.35%
1 jan 1992 ano
91.033
-7.086
-7.22%
1 jan 1993 ano
89.183
-1.85
-2.03%
1 jan 1994 ano
89.296
+0.112
0.13%
1 jan 1995 ano
95.53
+6.234
6.98%
1 jan 1996 ano
97.209
+1.679
1.76%
1 jan 1997 ano
101.231
+4.022
4.14%
1 jan 1998 ano
102.357
+1.126
1.11%
1 jan 1999 ano
107.435
+5.078
4.96%
1 jan 2000 ano
106.796
-0.639
-0.59%
1 jan 2001 ano
104.89
-1.906
-1.78%
1 jan 2002 ano
105.529
+0.639
0.61%
1 jan 2003 ano
110.741
+5.211
4.94%
1 jan 2004 ano
113.455
+2.714
2.45%
1 jan 2005 ano
106.063
-7.391
-6.51%
1 jan 2006 ano
102.585
-3.478
-3.28%
1 jan 2007 ano
89.626
-12.96
-12.63%
1 jan 2008 ano
95.898
+6.273
7.0%
1 jan 2009 ano
95.156
-0.743
-0.77%
1 jan 2010 ano
97.357
+2.201
2.31%
1 jan 2011 ano
97.415
+0.058
0.06%
1 jan 2012 ano
101.364
+3.948
4.05%
Classificação de países por estatísticas atuais por anos


Comentários: