29
/pt/
pt
AIzaSyAYiBZKx7MnpbEhh9jyipgxe19OcubqV5w
April 1, 2024
159462
Ireland
IRL
true
2
1
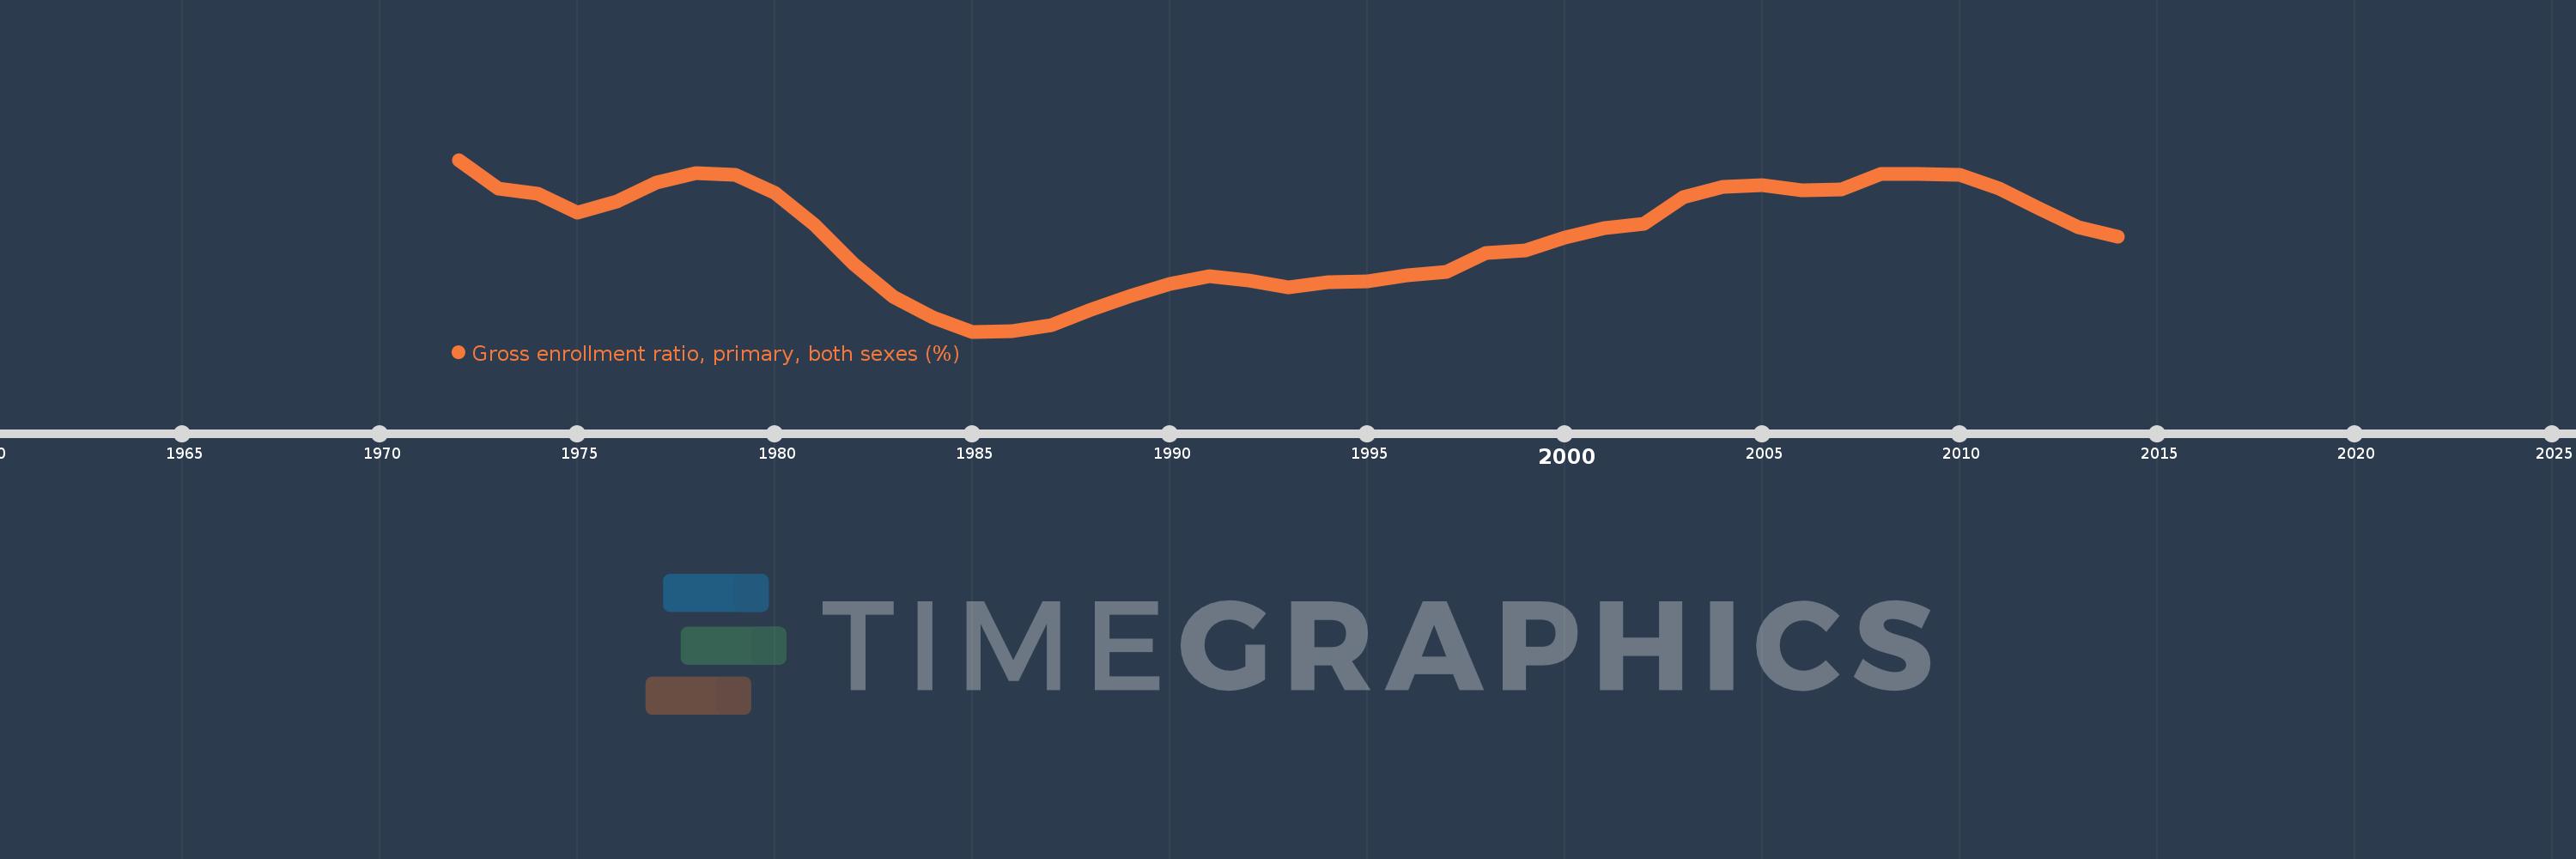
Gross enrollment ratio, primary, both sexes (%)
2014,2013,2012,2011,2010,2009,2008,2007,2006,2005,2004,2003,2002,2001,2000,1999,1998,1997,1996,1995,1994,1993,1992,1991,1990,1989,1988,1987,1986,1985,1984,1983,1982,1981,1980,1979,1978,1977,1976,1975,1974,1973,1972
Estas estatísticas em outros países:
AfghanistanAlbaniaAlgeriaAndorraAngolaAntigua and BarbudaArab WorldArgentinaArmeniaArubaAustraliaAustriaAzerbaijanBahamas, TheBahrainBangladeshBarbadosBelarusBelgiumBelizeBeninBermudaBhutanBoliviaBosnia and HerzegovinaBotswanaBrazilBritish Virgin IslandsBrunei DarussalamBulgariaBurkina FasoBurundiCabo VerdeCambodiaCameroonCanadaCaribbean small statesCentral African RepublicCentral Europe and the BalticsChadChileChinaColombiaComorosCongo, Dem. Rep.Congo, Rep.Costa RicaCote d'IvoireCroatiaCubaCuracaoCyprusCzech RepublicDenmarkDjiboutiDominicaDominican RepublicEarly-demographic dividendEast Asia & PacificEast Asia & Pacific (excluding high income)East Asia & Pacific (IDA & IBRD countries)EcuadorEgypt, Arab Rep.El SalvadorEquatorial GuineaEritreaEstoniaEthiopiaEuro areaEurope & Central AsiaEurope & Central Asia (excluding high income)Europe & Central Asia (IDA & IBRD countries)European UnionFijiFinlandFragile and conflict affected situationsFranceGabonGambia, TheGeorgiaGermanyGhanaGreeceGrenadaGuatemalaGuineaGuinea-BissauGuyanaHaitiHeavily indebted poor countries (HIPC)High incomeHondurasHong Kong SAR, ChinaHungaryIBRD onlyIcelandIDA & IBRD totalIDA blendIDA onlyIDA totalIndiaIndonesiaIran, Islamic Rep.IraqIrelandIsraelItalyJamaicaJapanJordanKazakhstanKenyaKiribatiKorea, Dem. People’s Rep.Korea, Rep.KuwaitKyrgyz RepublicLao PDRLate-demographic dividendLatin America & Caribbean Latin America & Caribbean (excluding high income)Latin America & the Caribbean (IDA & IBRD countries)LatviaLeast developed countries: UN classificationLebanonLesothoLiberiaLibyaLiechtensteinLithuaniaLow & middle incomeLow incomeLower middle incomeLuxembourgMacao SAR, ChinaMacedonia, FYRMadagascarMalawiMalaysiaMaldivesMaliMaltaMarshall IslandsMauritaniaMauritiusMexicoMicronesia, Fed. Sts.Middle East & North AfricaMiddle East & North Africa (excluding high income)Middle East & North Africa (IDA & IBRD countries)Middle incomeMoldovaMongoliaMontenegroMoroccoMozambiqueMyanmarNamibiaNauruNepalNetherlandsNew ZealandNicaraguaNigerNigeriaNorth AmericaNorwayOECD membersOmanOther small statesPacific island small statesPakistanPalauPanamaPapua New GuineaParaguayPeruPhilippinesPolandPortugalPost-demographic dividendPre-demographic dividendPuerto RicoQatarRomaniaRussian FederationRwandaSamoaSan MarinoSao Tome and PrincipeSaudi ArabiaSenegalSerbiaSeychellesSierra LeoneSlovak RepublicSloveniaSmall statesSolomon IslandsSomaliaSouth AfricaSouth AsiaSouth Asia (IDA & IBRD)South SudanSpainSri LankaSt. Kitts and NevisSt. LuciaSt. Vincent and the GrenadinesSub-Saharan Africa Sub-Saharan Africa (excluding high income)Sub-Saharan Africa (IDA & IBRD countries)SudanSurinameSwazilandSwedenSwitzerlandSyrian Arab RepublicTajikistanTanzaniaThailandTimor-LesteTogoTongaTrinidad and TobagoTunisiaTurkeyTurkmenistanTuvaluUgandaUkraineUnited Arab EmiratesUnited KingdomUnited StatesUpper middle incomeUruguayUzbekistanVanuatuVenezuela, RBVietnamWest Bank and GazaWorldYemen, Rep.ZambiaZimbabwe Linha do tempo:
Nesta escala de tempo está apresentado um gráfico de 1972 ano até 2014 ano Ireland. Dados de 1971 ano ausente. O número de observações reais por data: 43.
Fonte (nome):
Indicadores de desenvolvimento mundial
Fonte (organização):
UNESCO Institute for Statistics
Categorias:
Education
Foi atualizado:
23 abr 2017 ano
Indicadores de alterações dos valores ao longo dos anos
Mínimo:
95.086
1 jan 1985 ano
Máximo:
109.177
1 jan 1972 ano
Na data de observação
Valor
Mudança absoluta
A alteração em relação ao valor anterior
1 jan 1972 ano
109.177
+109.177
0.0%
1 jan 1973 ano
106.793
-2.383
-2.18%
1 jan 1974 ano
106.412
-0.382
-0.36%
1 jan 1975 ano
104.832
-1.579
-1.48%
1 jan 1976 ano
105.751
+0.919
0.88%
1 jan 1977 ano
107.294
+1.543
1.46%
1 jan 1978 ano
108.081
+0.787
0.73%
1 jan 1979 ano
107.93
-0.151
-0.14%
1 jan 1980 ano
106.459
-1.471
-1.36%
1 jan 1981 ano
103.847
-2.613
-2.45%
1 jan 1982 ano
100.594
-3.253
-3.13%
1 jan 1983 ano
97.917
-2.677
-2.66%
1 jan 1984 ano
96.226
-1.691
-1.73%
1 jan 1985 ano
95.086
-1.139
-1.18%
1 jan 1986 ano
95.103
+0.016
0.02%
1 jan 1987 ano
95.613
+0.51
0.54%
1 jan 1988 ano
96.859
+1.246
1.3%
1 jan 1989 ano
98.021
+1.162
1.2%
1 jan 1990 ano
98.993
+0.972
0.99%
1 jan 1991 ano
99.62
+0.626
0.63%
1 jan 1992 ano
99.261
-0.359
-0.36%
1 jan 1993 ano
98.707
-0.554
-0.56%
1 jan 1994 ano
99.158
+0.451
0.46%
1 jan 1995 ano
99.242
+0.084
0.08%
1 jan 1996 ano
99.717
+0.475
0.48%
1 jan 1997 ano
99.957
+0.241
0.24%
1 jan 1998 ano
101.514
+1.557
1.56%
1 jan 1999 ano
101.771
+0.257
0.25%
1 jan 2000 ano
102.789
+1.017
1.0%
1 jan 2001 ano
103.566
+0.778
0.76%
1 jan 2002 ano
103.934
+0.368
0.36%
1 jan 2003 ano
106.096
+2.162
2.08%
1 jan 2004 ano
106.972
+0.876
0.83%
1 jan 2005 ano
107.116
+0.144
0.13%
1 jan 2006 ano
106.686
-0.43
-0.4%
1 jan 2007 ano
106.727
+0.041
0.04%
1 jan 2008 ano
108.011
+1.284
1.2%
1 jan 2009 ano
108.028
+0.017
0.02%
1 jan 2010 ano
107.926
-0.102
-0.09%
1 jan 2011 ano
106.789
-1.136
-1.05%
1 jan 2012 ano
105.208
-1.582
-1.48%
1 jan 2013 ano
103.638
-1.57
-1.49%
1 jan 2014 ano
102.861
-0.777
-0.75%
Classificação de países por estatísticas atuais por anos


Comentários: