29
/pt/
pt
AIzaSyAYiBZKx7MnpbEhh9jyipgxe19OcubqV5w
April 1, 2024
39586
IDA only
IDX
false
2
1
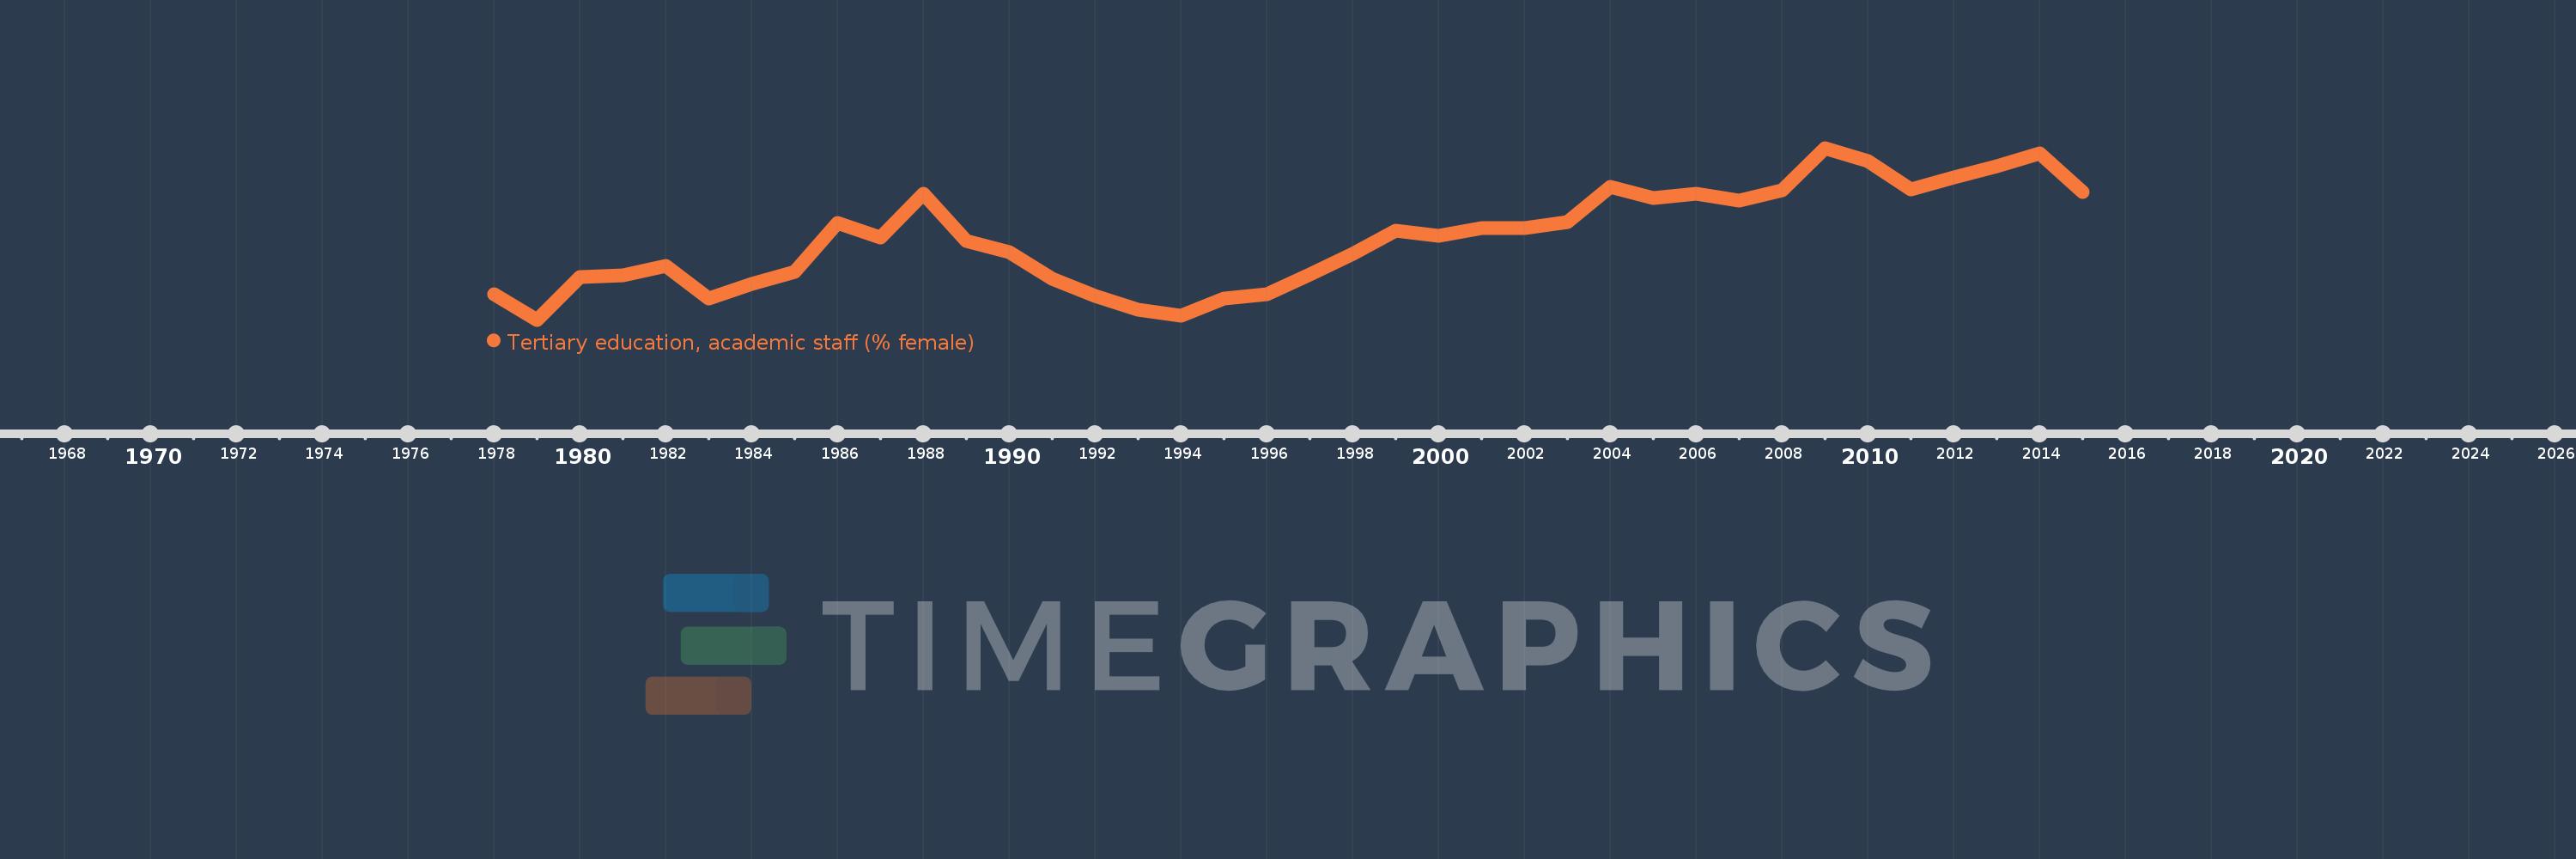
Tertiary education, academic staff (% female)
2015,2014,2013,2012,2011,2010,2009,2008,2007,2006,2005,2004,2003,2002,2001,2000,1999,1998,1997,1996,1995,1994,1993,1992,1991,1990,1989,1988,1987,1986,1985,1984,1983,1982,1981,1980,1979,1978
Estas estatísticas em outros países:
AfghanistanAlbaniaAlgeriaAndorraAngolaAntigua and BarbudaArab WorldArgentinaArmeniaArubaAustraliaAustriaAzerbaijanBahamas, TheBahrainBangladeshBarbadosBelarusBelgiumBelizeBeninBermudaBhutanBoliviaBosnia and HerzegovinaBotswanaBrazilBritish Virgin IslandsBrunei DarussalamBulgariaBurkina FasoBurundiCabo VerdeCambodiaCameroonCanadaCaribbean small statesCayman IslandsCentral African RepublicCentral Europe and the BalticsChadChileChinaColombiaComorosCongo, Dem. Rep.Congo, Rep.Costa RicaCote d'IvoireCroatiaCubaCyprusCzech RepublicDenmarkDjiboutiDominicaDominican RepublicEarly-demographic dividendEast Asia & PacificEast Asia & Pacific (excluding high income)East Asia & Pacific (IDA & IBRD countries)EcuadorEgypt, Arab Rep.El SalvadorEquatorial GuineaEritreaEstoniaEthiopiaEuro areaEurope & Central AsiaEurope & Central Asia (excluding high income)Europe & Central Asia (IDA & IBRD countries)European UnionFijiFinlandFragile and conflict affected situationsFranceGabonGambia, TheGeorgiaGermanyGhanaGreeceGrenadaGuineaGuyanaHaitiHeavily indebted poor countries (HIPC)High incomeHondurasHong Kong SAR, ChinaHungaryIBRD onlyIcelandIDA & IBRD totalIDA blendIDA onlyIDA totalIndiaIndonesiaIran, Islamic Rep.IraqIrelandItalyJamaicaJapanJordanKazakhstanKorea, Dem. People’s Rep.Korea, Rep.KuwaitKyrgyz RepublicLao PDRLate-demographic dividendLatin America & Caribbean Latin America & Caribbean (excluding high income)Latin America & the Caribbean (IDA & IBRD countries)LatviaLeast developed countries: UN classificationLebanonLesothoLiberiaLibyaLiechtensteinLithuaniaLow & middle incomeLow incomeLower middle incomeLuxembourgMacao SAR, ChinaMacedonia, FYRMadagascarMalawiMalaysiaMaldivesMaliMaltaMarshall IslandsMauritaniaMauritiusMicronesia, Fed. Sts.Middle East & North AfricaMiddle East & North Africa (excluding high income)Middle East & North Africa (IDA & IBRD countries)Middle incomeMoldovaMongoliaMoroccoMozambiqueMyanmarNamibiaNepalNetherlandsNew ZealandNicaraguaNigerNigeriaNorth AmericaNorwayOECD membersOmanOther small statesPacific island small statesPakistanPalauPanamaPapua New GuineaPeruPhilippinesPolandPortugalPost-demographic dividendPre-demographic dividendPuerto RicoQatarRomaniaRussian FederationRwandaSamoaSao Tome and PrincipeSaudi ArabiaSenegalSerbiaSeychellesSierra LeoneSingaporeSint Maarten (Dutch part)Slovak RepublicSloveniaSmall statesSomaliaSouth AfricaSouth AsiaSouth Asia (IDA & IBRD)SpainSri LankaSt. Kitts and NevisSt. LuciaSt. Vincent and the GrenadinesSub-Saharan Africa Sub-Saharan Africa (excluding high income)Sub-Saharan Africa (IDA & IBRD countries)SudanSurinameSwazilandSwedenSwitzerlandSyrian Arab RepublicTajikistanTanzaniaThailandTimor-LesteTogoTongaTrinidad and TobagoTunisiaTurkeyTurkmenistanUgandaUnited Arab EmiratesUnited KingdomUnited StatesUpper middle incomeUruguayUzbekistanVenezuela, RBVietnamWest Bank and GazaWorldYemen, Rep.Zimbabwe Linha do tempo:
Nesta escala de tempo está apresentado um gráfico de 1978 ano até 2015 ano IDA only. Dados de 1977 ano ausente. O número de observações reais por data: 38.
Fonte (nome):
Indicadores de desenvolvimento mundial
Fonte (organização):
United Nations Educational, Scientific, and Cultural Organization (UNESCO) Institute for Statistics.
Categorias:
Education
Foi atualizado:
23 abr 2017 ano
Indicadores de alterações dos valores ao longo dos anos
Mínimo:
22.517
1 jan 1979 ano
Máximo:
26.41
1 jan 2009 ano
Na data de observação
Valor
Mudança absoluta
A alteração em relação ao valor anterior
1 jan 1978 ano
23.101
+23.101
0.0%
1 jan 1979 ano
22.517
-0.584
-2.53%
1 jan 1980 ano
23.488
+0.971
4.31%
1 jan 1981 ano
23.519
+0.031
0.13%
1 jan 1982 ano
23.746
+0.227
0.96%
1 jan 1983 ano
22.995
-0.751
-3.16%
1 jan 1984 ano
23.332
+0.337
1.46%
1 jan 1985 ano
23.606
+0.273
1.17%
1 jan 1986 ano
24.706
+1.1
4.66%
1 jan 1987 ano
24.379
-0.327
-1.32%
1 jan 1988 ano
25.373
+0.994
4.08%
1 jan 1989 ano
24.309
-1.064
-4.19%
1 jan 1990 ano
24.044
-0.265
-1.09%
1 jan 1991 ano
23.448
-0.596
-2.48%
1 jan 1992 ano
23.058
-0.39
-1.66%
1 jan 1993 ano
22.753
-0.305
-1.32%
1 jan 1994 ano
22.613
-0.141
-0.62%
1 jan 1995 ano
22.998
+0.385
1.7%
1 jan 1996 ano
23.094
+0.097
0.42%
1 jan 1997 ano
23.538
+0.444
1.92%
1 jan 1998 ano
24.019
+0.48
2.04%
1 jan 1999 ano
24.527
+0.508
2.12%
1 jan 2000 ano
24.423
-0.104
-0.42%
1 jan 2001 ano
24.589
+0.166
0.68%
1 jan 2002 ano
24.601
+0.012
0.05%
1 jan 2003 ano
24.727
+0.126
0.51%
1 jan 2004 ano
25.521
+0.794
3.21%
1 jan 2005 ano
25.283
-0.238
-0.93%
1 jan 2006 ano
25.371
+0.087
0.35%
1 jan 2007 ano
25.219
-0.152
-0.6%
1 jan 2008 ano
25.457
+0.238
0.94%
1 jan 2009 ano
26.41
+0.953
3.74%
1 jan 2010 ano
26.106
-0.305
-1.15%
1 jan 2011 ano
25.465
-0.64
-2.45%
1 jan 2012 ano
25.733
+0.267
1.05%
1 jan 2013 ano
25.994
+0.261
1.02%
1 jan 2014 ano
26.293
+0.299
1.15%
1 jan 2015 ano
25.419
-0.874
-3.32%
Classificação de países por estatísticas atuais por anos


Comentários: